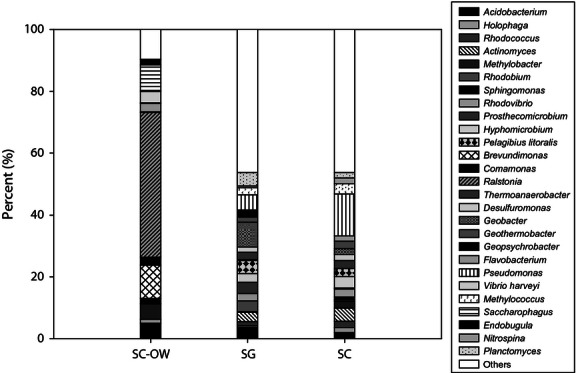
Figure 5.

Compositions of bacterial communities in sediments collected at stations SG and SC, and in overlying waters of SC sediments (SC-OW). The relative abundance of each bacterial species shown in the figure was at least 2% or above in one of the three samples. The species not shown on the bar were categorized as others. Clearly, bacterial communities in the SG and SC sediments were much more diverse than those of the SC-OW. SG, station Grab; SC, station Core; SC-OW, overlying water of SC sediment.
