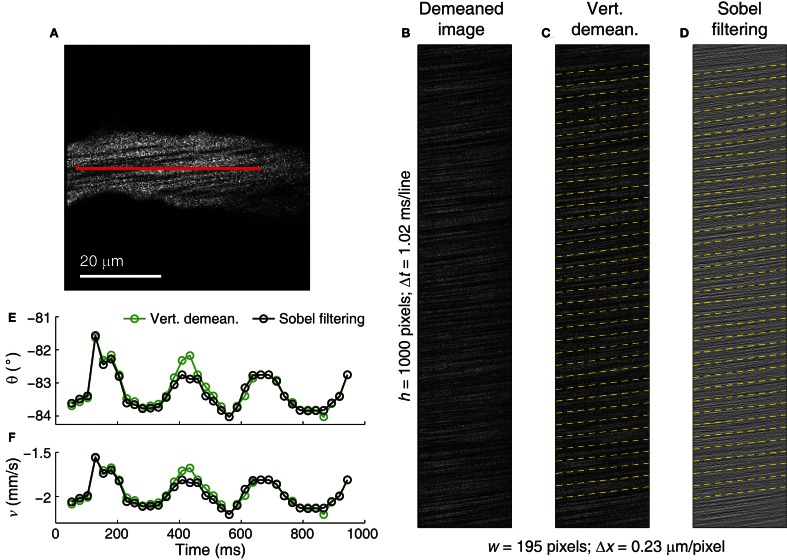
Figure 10.
Application of Sobel filtering on an image with thin RBC streaks. (A) Reference full-frame image of a 14 μm diameter venule in the cat visual cortex. The line-scan trajectory is shown as a red line. (B) Line-scan image from the microvessel showing thin, near-horizontal RBC streaks. (C) Vertically demeaned image of (B) showing measured RBC streak angle and velocity (dashed yellow lines). (D) Sobel filtered image of (B) shows RBC streak enhancement, measured RBC streak angle and velocity. Dashed yellow lines represent measured angles over image segments of 100 lines. (E,F) Angle (E) and velocity (F) traces after vertical demeaning (green traces) and Sobel filtering (black traces). Circles represent the dashed lines shown in (C) and (D). Subtle difference in the values is the result of different filtering (also see Figure 8). δ of ~0.0055° was used in order to achieve Δv/v of <0.1% (see Equation 17) on the overlapping image segments of 100 lines which offered δn of <0.001° (see Equations 11–14).

