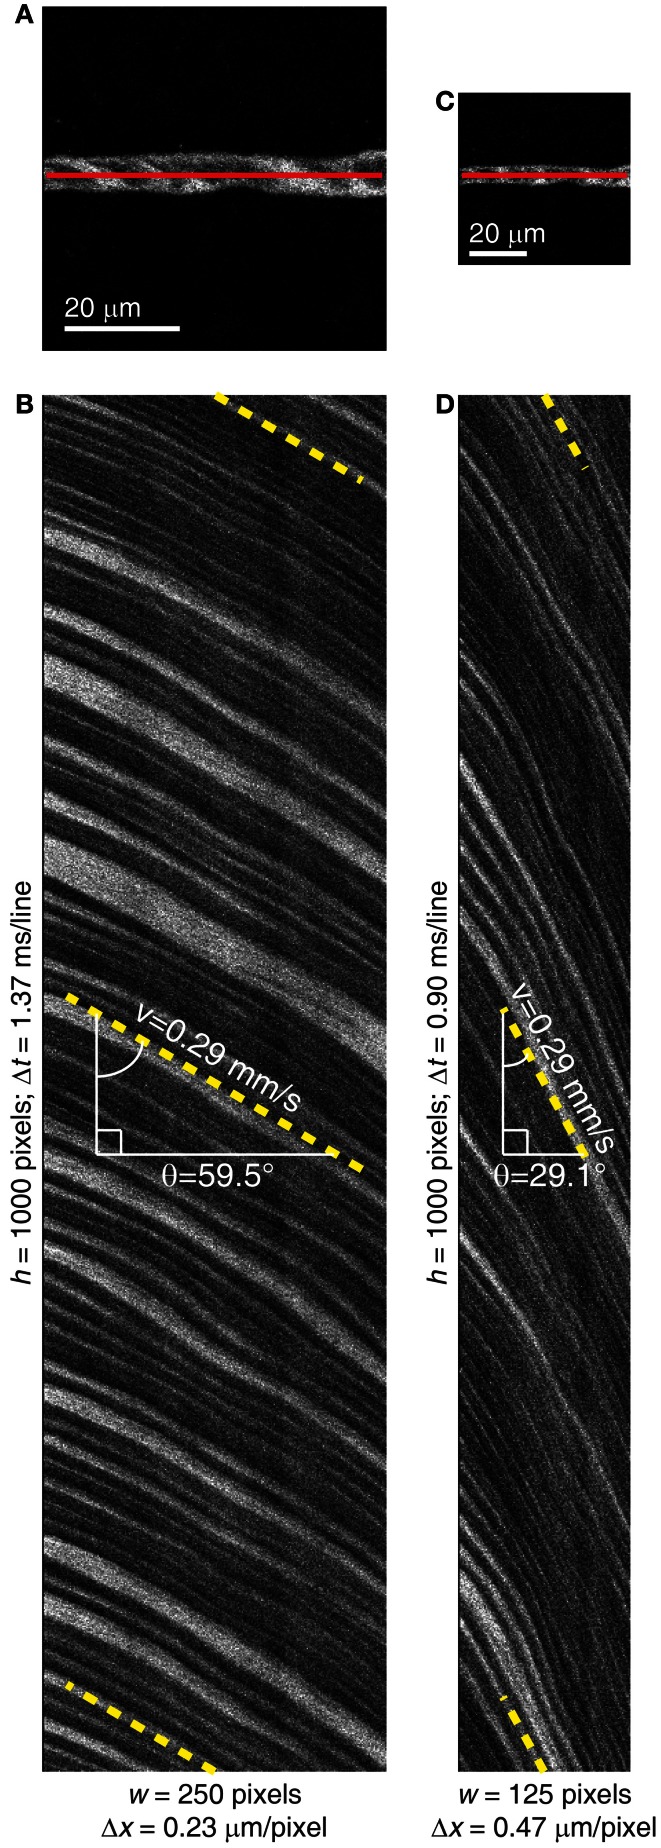
Figure 2.
Change in the pixel resolution leads to change in the RBC streak angle. (A) Full-frame image of an 8 μm diameter microvessel segment in the rat visual cortex with the line-scan trajectory shown as a red line. (B) Space-time image collected from the vessel shown in (A). Line-scan imaging with spatial resolution (Δx) of 0.23 μm/pixel and period (Δt) of 1.37 ms/line was used. Pixel dwell time was 4 μs. The RBC streaks have angle of 59.5° (dashed yellow lines) and blood velocity of 0.29 mm/s. (C) Full-frame image of the same microvessel segment as shown in (A) but with coarser spatial resolution. (D) Space-time image collected with the same line-scan path but with bigger pixel size (Δx = 0.47 μm/pixel) leading to shorter line-scan time (Δt = 0.9 ms/line). This resulted in the RBC streak angle of 29.1° (dashed yellow lines) and blood velocity of 0.29 mm/s. The mean ± SD velocity from the acquired 20 line-scan images was 0.28 ± 0.02 mm/s in (A) and 0.29 ± 0.02 mm/s in (C) (p = 0.54, two-sample t-test).

