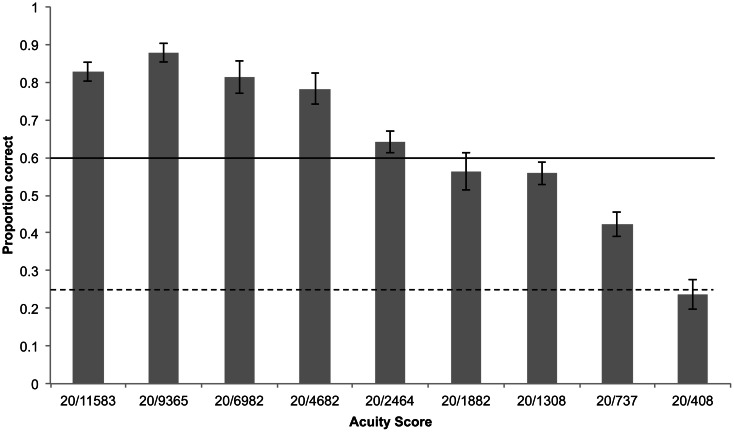
Figure 9.
Mean proportion of correctly identified optotype orientations using camera glasses by all participants for each block, shown on the X-axis as its corresponding acuity score. Error bars represent standard error of the mean, horizontal solid line represents threshold of 0.6 (8/12 correct responses), dashed line represents chance performance.

