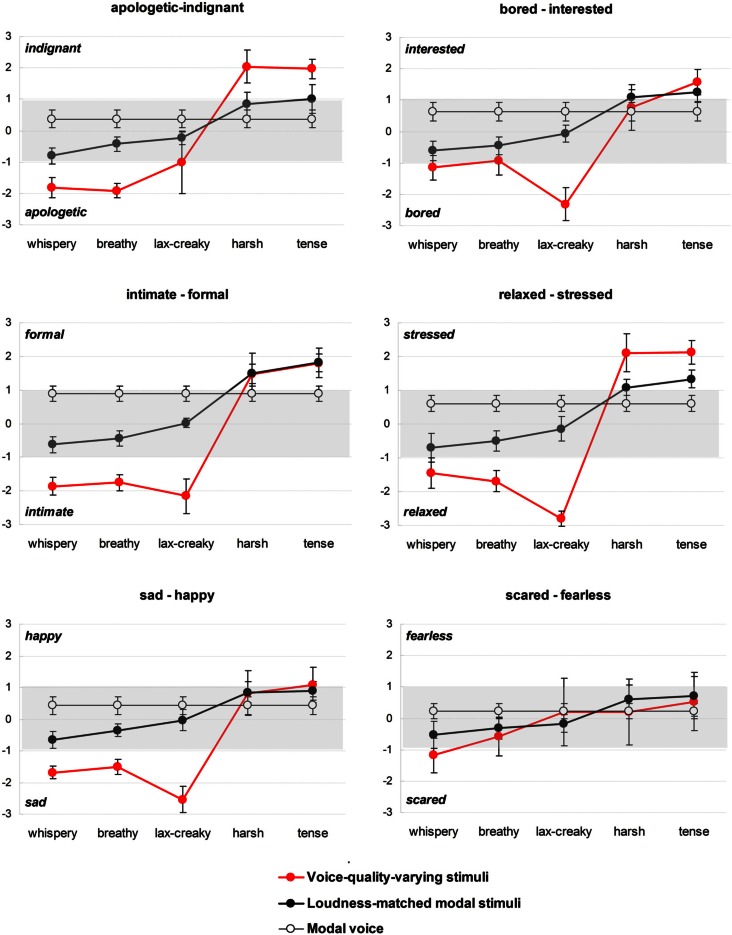
Figure 1.
Affective ratings of the stimuli in Experiment 1. Voice-quality-varying stimuli are shown in red and the corresponding loudness-matched modal stimuli are shown in black. As a reference, the ratings obtained for the modal voice stimulus are also shown (white data points joined by a fine black line). Plotted are estimated marginal means and 95% confidence intervals. Shaded is the area of weak affect cueing.

