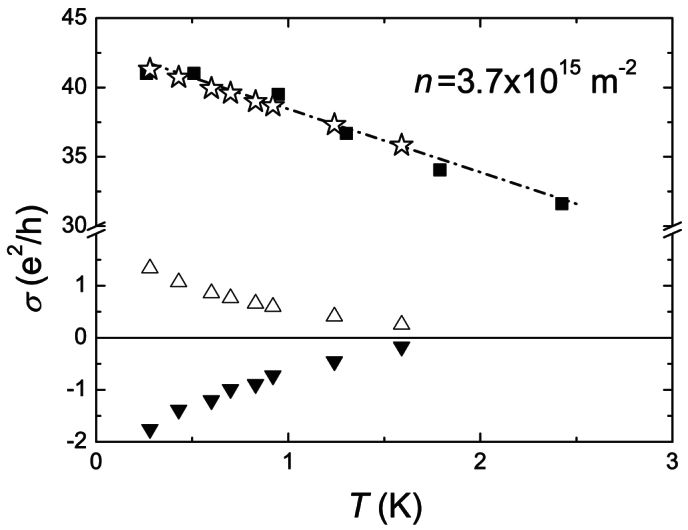
Figure 4. Conductivity of the sample Si15 from Ref. 35.

The data ( ) were analysed in the same way as those of Fig. 2. Fit of σD + σBall to these data (– · –), diffusive contribution (
 ), WL contribution (
 ) and the sum of Drude, WL, diffusive and ballistic contributions (
 ). Despite all interaction channels contribute (see the text), the cancellation of WL and diffusive interaction corrections is observed with α = 1,
  and
and  . Here rs ≈ 4.3 compared to 8.2 in our SOI sample.
