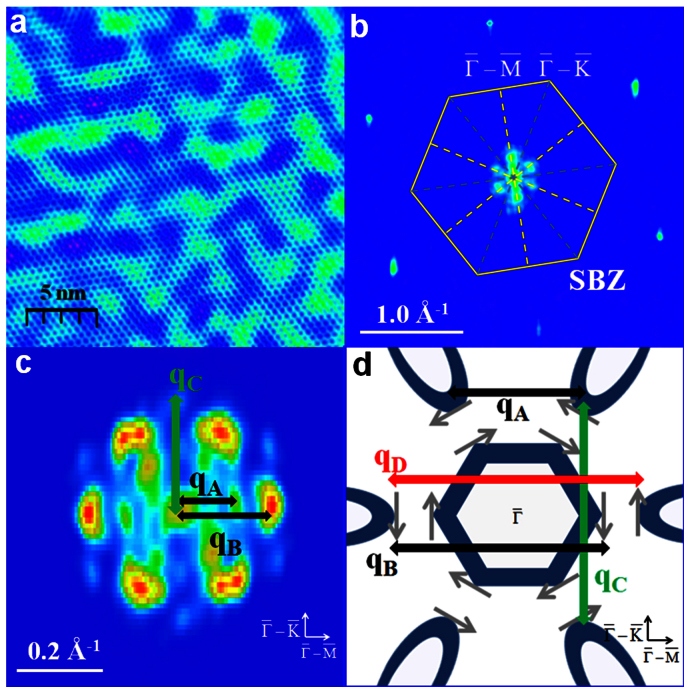
Figure 2. QPI patterns of TSS on 30-BL Sb(111).
(a) Real-space dI/dVb map in an area of 20 nm × 20 nm taken at Vb = 40 mV, I = 120 pA. (b) Fourier transform of (a), consisting of six strong peaks along  . The first SBZ (yellow hexagon) and high symmetry directions are marked. (c) FT-STS pattern around
  with three observable scattering vectors qA, qBand qC. It was taken on a 40 nm × 40 nm area at Vb = 20 mV. (d) Schematic of CEC as well as the spin texture around
  , which has a central electron pocket and six hole pockets. The small grey arrows represent the spin directions. qAand qB are allowed scattering vectors, while qC is low in probability and qD totally forbidden.

