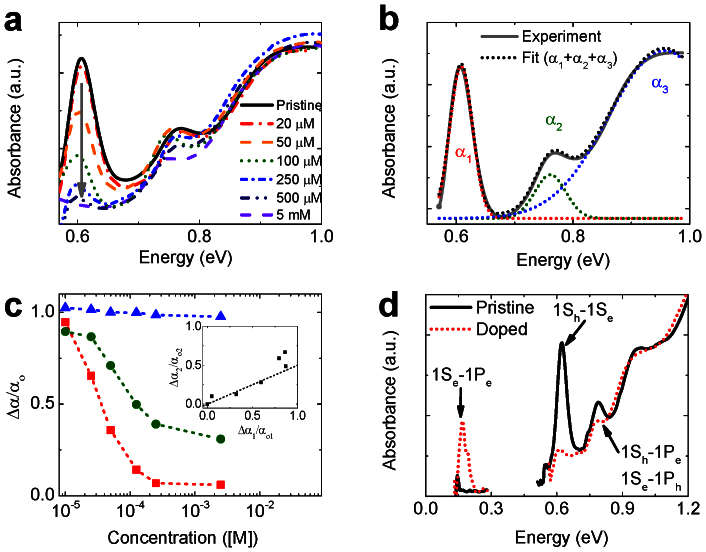
Figure 2. Effect of treatment with cobaltocene on inter-band and intra-band absorption spectra of PbSe NCs.
(a) Absorption spectra of 7.9 nm diameter PbSe NCs as a function of cobaltocene concentration. (b) Fitting of the absorption spectrum of pristine PbSe NCs to the sum of the three Gaussian bands (dashed black line) that describe the 1st (α1, dash red line), 2nd (α2, dash green line), and 3rd (α3, dash blue line) inter-band transitions. (c) Normalized absorption intensity Δαi/αi (i = 1, 2, 3) in each transition (1st: red squares; 2nd: green circles, 3rd: blue triangles) for treated PbSe NCs as a function of the concentration of cobaltocene. Inset: Correlation of Δα1/αo1 and Δα2/αo2. (d) Pristine (solid black line) and cobaltocene-treated (dash red line) PbSe NCs.

