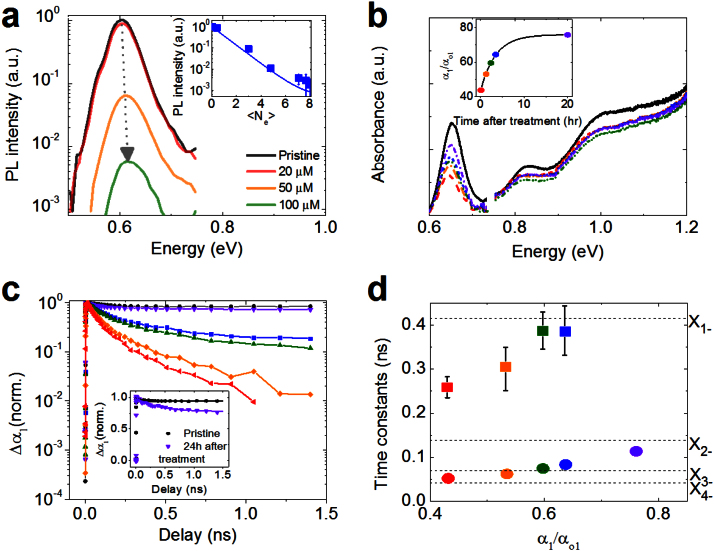
Figure 3. Spectroscopic signatures of ground-state charging.
(a) Cobaltocene-concentration dependent PL quenching of PbSe NCs. Inset: PL intensity (symbols) as a function of the average number of injected electrons derived from <Ne> = 8|Δα1/αo1| along with the calculated PL intensity (line). (b) Absorption spectrum of pristine PbSe NCs (solid black line) along with spectra of treated NCs at different times during absorption recovery (dashed and dashed-dotted lines). Inset: Recovery of 1S band-edge absorption, color-coding is the same as in the main panel. (c) 1S TA dynamics of the sample from (b) during 1S absorption recovery (color coding is the same as in panel b); pump photon energy is 1.55 eV and excitation flux corresponds to Nph = 0.4 absorbed photon per pulse per NC. Inset: Low fluence scans (Nph = 0.1) of the pristine sample (black) and the treated sample following 20 h recovery (violet). (d) Two time constants (symbols, color coding is the same as in panels b and c) of the recovering sample derived from a double exponential fit of the measured TA decay. Horizontal dashed lines represent Auger lifetimes of the exciton in NCs in the presence of different numbers of excess electrons.

