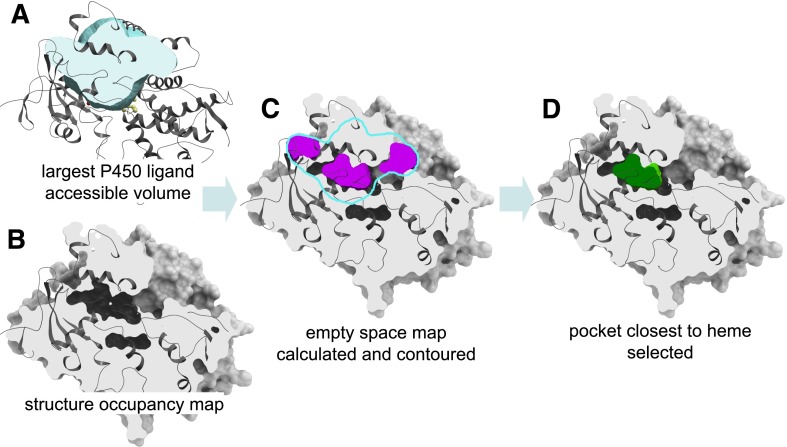
Fig. 1.
Steps of the procedure for the calculation of shapes and volumes of ligand binding pockets in P450 structures. (A) The maximal volume accessible to ligands is calculated as the combined Gaussian atomic density map of catalytic site ligands in all available crystallographic structures of P450 in the PDB after superimposition of the binding sites. (B) For each P450 structure, the atomic density map is calculated in the presence of heme and iron but after deletion of ligands and water molecules. (C) The empty space grid map for the P450 structure is calculated by rolling a carbon probe on a 0.5 Å grid within the maximal ligand accessible volume and evaluating the probe overlap with the structure density map at each grid point. The resulting empty space map is contoured at the value of 0.45, producing a set of (typically discontinuous) closed meshes closely approximating the van der Waals surface of the P450 protein. (D) The mesh closest to the heme iron atom represents the catalytic pocket in its respective structure.

