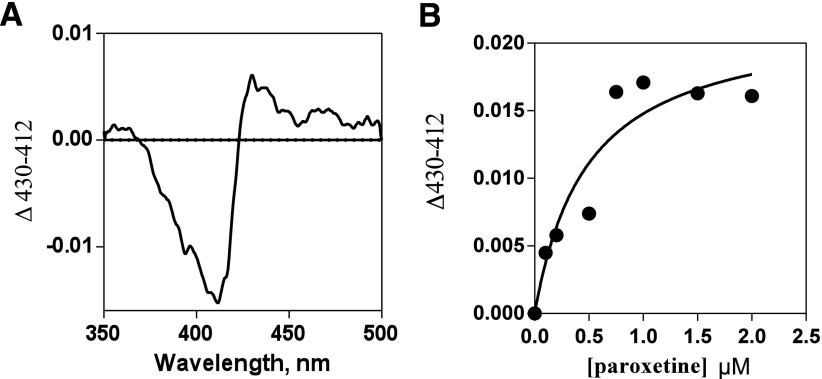
Fig. 2.
Spectral titrations of CYP2B4 with paroxetine. (A) A difference spectra showing the maximum type II change obtained after the addition of paroxetine. (B) The fitting of the hyperbolic titration curve to the tight binding Eq. 2 ΔA = (ΔAmax/[E0]) - [Kd + [I0] + [E0] + (Kd + [I0] + [E0])2 - (4[E0][I0])1/2] (Segel, 1975) is shown as a solid line (B).

