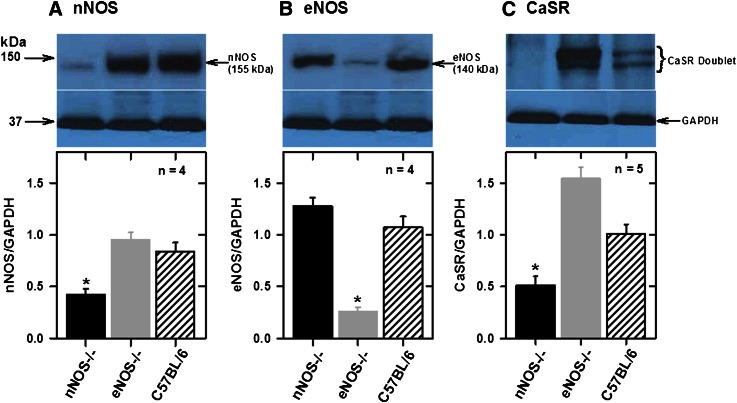
Fig. 1.
Analysis of NOS isoforms and CaSR expressions in mesenteric arcades from C57BL/6 (control) and NOS−/− mice. Western blot analysis of nNOS (A), eNOS (B), and CaSR (C) in tissues from control and NOS−/− mice. Bar charts show individual density values of protein bands expressed as ratios of glyceraldehyde-3-phosphate dehydrogenase (GAPDH) expression. nNOS knockout downregulates but eNOS knockout upregulates CaSR expression. *P < 0.001 vs. other groups; one-way analysis of variance (ANOVA).

