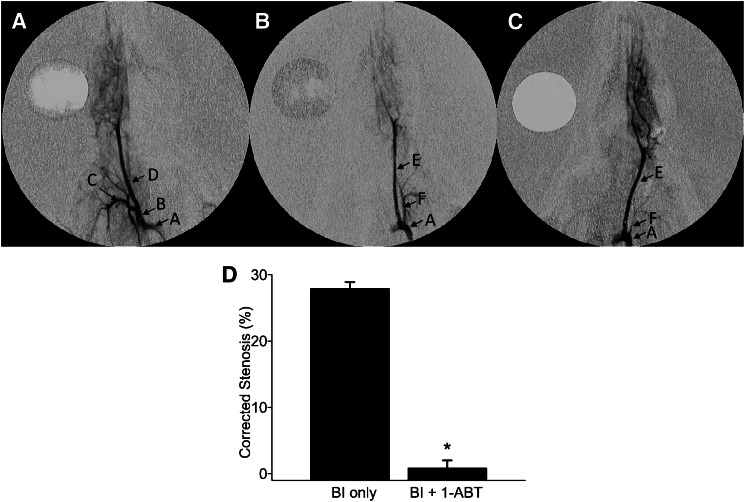
Fig. 1.
Angiography analysis of carotid artery stenosis induced by balloon injury (BI). Anteroposterior angiograms of rat common carotid arteries 14 days after BI. (A) A representative image from an uninjured right control carotid artery. (B) Image from a BI left carotid artery. (C) Image from a BI carotid artery in a rat treated with 1-ABT. (D) Summary of the percentage change in angiographic stenosis in the BI left carotid arteries of control rats (BI only, n = 10) or rats chronically treated with 1-ABT (BI + 1-ABT, n = 10). The mean value ± S.E.M. is shown. *Statistically significant difference from the corresponding value in BI control rats. The mean value ± S.E.M. is shown. Arrows indicate the location of the aortic arch (A), brachiocephalic trunk (B), right subclavian artery (C), right common carotid artery (D), left common carotid artery (E), and left subclavian artery (F).

