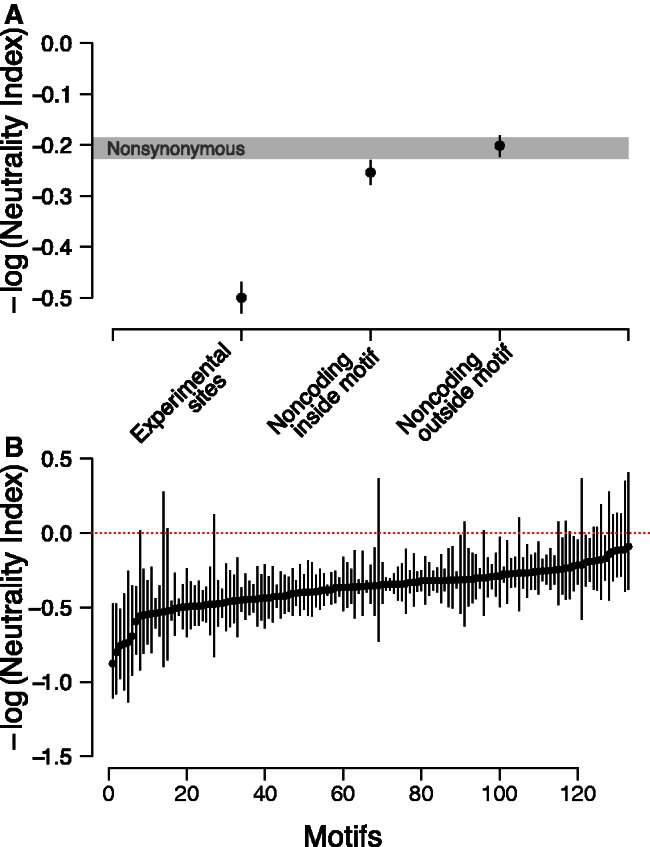
Fig. 2.

Evolutionary forces acting at intergenic regions. (A) –log(NI) scores for three classes of sites (experimentally determined sites, noncoding sites falling within predicted motifs, and noncoding sites falling outside predicted motifs) are plotted. –log(NI) scores were obtained by summing information across all sites of a particular class and using synonymous sites within genes as putatively neutral sites. Confidence intervals were obtained by bootstrapping (see Materials and Methods). 95% CI for nonsynonymous sites are shown as in gray. (B) –log(NI) scores for each of 133 motifs, sorted from lowest –log(NI) to highest –log(NI). –log(NI) scores were obtained by summing information across all sites genome-wide falling within a particular motif, and comparing with all synonymous sites. Motifs with low numbers of polymorphic and divergent sites were excluded due to low power to detect differences with such low counts (<15 total sites). Confidence intervals were obtained by bootstrapping (see Materials and Methods).
