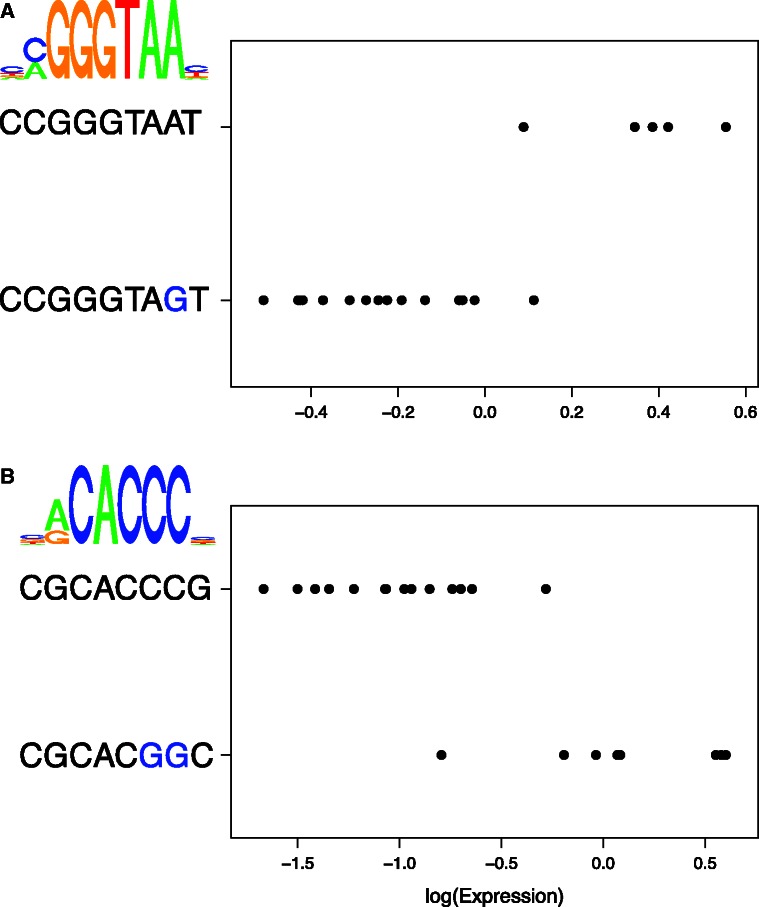
Fig. 3.
Examples of motifs effecting gene expression. (A) NAR1 expression in strains containing the two labeled sequences at the motif REB1 in the upstream intergenic region. Substitutions to the consensus motif sequence for REB1 are marked in blue. A sequence logo for REB1 representing the PSSM is shown in the upper left corner. (B) YER186C expression in strains containing the two labeled sequences at the motif AFT2 in the upstream intergenic regions. Substitutions to the consensus motif sequence are marked in blue. A sequence logo for AFT2 representing the PSSM is shown to the upper left of the plot.

