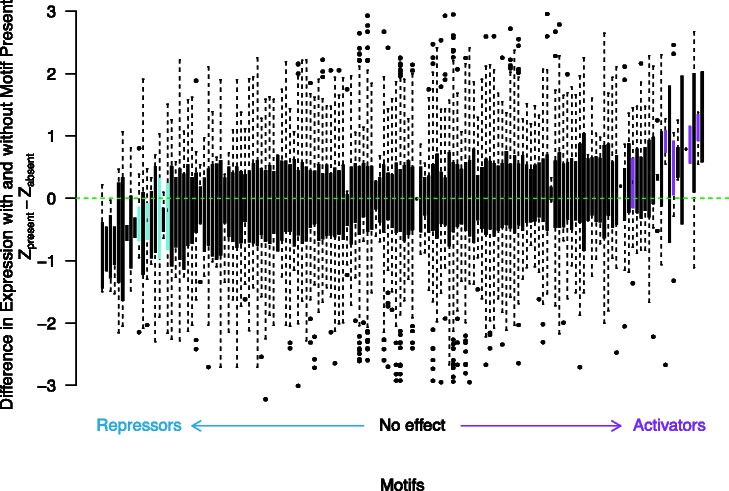
Fig. 4.
Effects of variants at specific motifs on gene expression. For each motif, a box plot of the difference in expression Z scores between strains containing the motif and strains not containing the motif at all genes with a variable motif are plotted. Motifs are sorted by mean difference in expression. Motifs significant in our test for genome-wide differences in expression for showing lower expression when the motif is present are colored in blue, and motifs significant for showing greater expression when the motif is present are colored in magenta.

