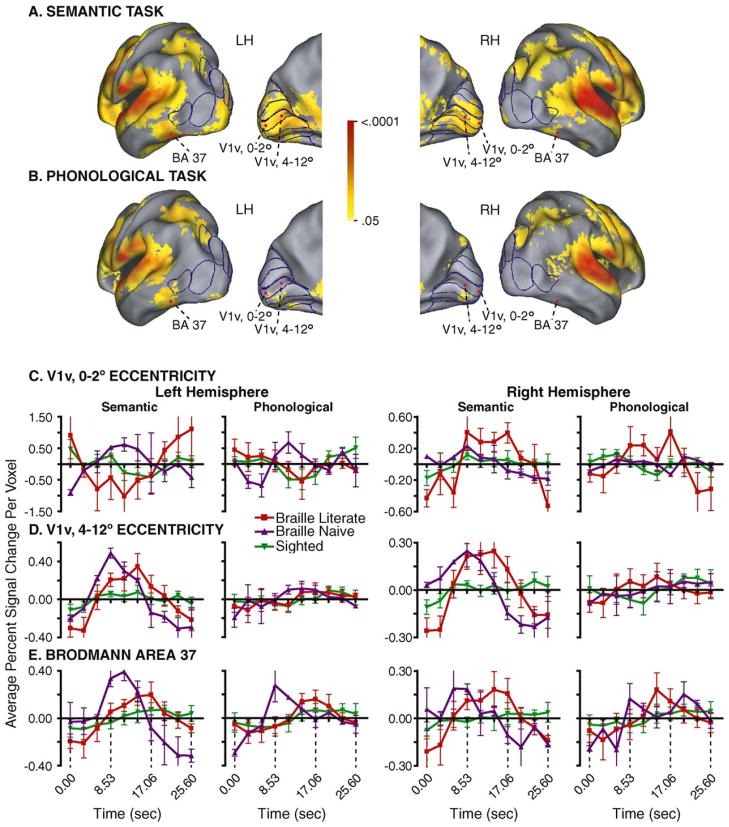
Fig. 1.
Activated visual cortex in Braille naive late-onset blind and example response time courses in sighted, Braille naive and Braille literate late-onset blind people. (A) Activity distribution during a semantic language task is shown projected to the cortical surface using a population-average, landmark and surface-based atlas (PALS) [20]. The medial hemisphere view shows borders from the PALS atlas for V1, V2, V3, VP, and V4v; the angled lateral hemisphere view shows borders for the superior V7, V3a, and V3 and inferior V5/MT+ and LOC. (B) Activity distribution during a phonological language task. Illustrated cortical distributions in (A) and (B) were created with the following supervised scheme. First, multiple-comparison corrected cross-correlation z-score maps (z = 3 over 45 face-connected voxels) from each Braille naive late-onset blind participant were projected onto the associated surface nodes in 12 normal individuals. The resulting z-score values at each node were averaged across these 12 individuals (scale shows p-values of the nodal average z-scores). Displayed activation is the average of the two participants, provided that both had activation at that node. (C) Time course plots associated with the 0–2° eccentricity partition in V1v. (D) Time course plots associated with the 4–12° eccentricity partition in V1v. (E) Time course plots associated with the non-visuotopic, posterior part of BA 37. Time courses were extracted from volumes whose approximate centers are marked by magenta dots in (A) and (B). Data at each time course interval shows the group mean and S.E.M. Braille naive (NBR, purple), Braille literate (LB, red) and sighted (NS, green). Abbreviations: Brodmann area, BA; ventral primary visual area, V1v.

