Fig. 2.
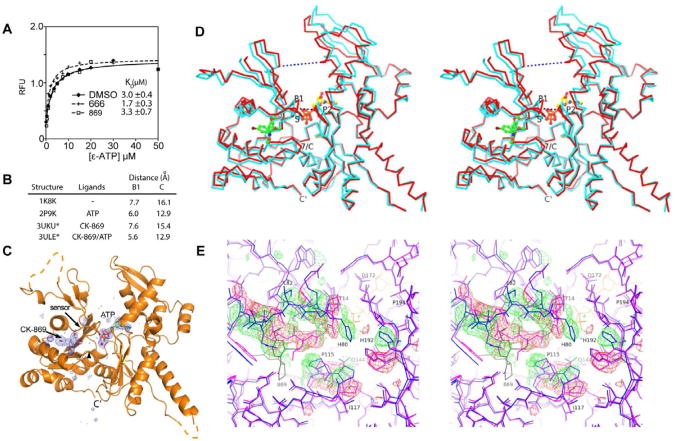
CK-869 influences ATP-induced conformational changes in Arp3. (A) ε-ATP binding assays with BtArp2/3 complex (0.4 μM) and 200 μM of either CK-666 or CK-869 was titrated with ε-ATP and the fluorescence measured. (B) Binding of CK-869 does not block ATP-induced closure of the nucleotide cleft. Distances across nucleotide cleft as described in D. Asterisked structures are reported here. (C) Difference electron density maps calculated without phase contributions from ATP, Ca2+ (red sphere), or CK-869 contoured at 3.0 σ show strong density for both ATP and CK-869 bound to Arp3 subunit. (D) Stereoview of Cα trace of Arp3 from the CK-869/ATP structure (red) with overlaid Arp3 from the apo-enzyme CK-869 structure. CK-869 is shown in stick representation with green carbons and ATP with yellow carbons. Black dotted line indicates the B1 distance (Thr14 CA to Gly173 CA) and the blue dotted line indicates the C distance (Gly67 CA - Glu202 CA). P1: P1 phosphate binding loop, P2: P2 phosphate binding loop, 7/C: β7/αC loop, S: sensor loop. (E) Conformational changes caused by binding of CK-869 to the ATP-bound complex. Close up stereo view of Arp3 from ATP bound inhibitor-free complex (2P9K.pdb, purple sticks) overlaid onto Arp3 from the CK-869/ATP structure (blue sticks, ATP in yellow lines). Positive 3.0 σ (green) and negative 3.5 σ (red) electron density from a difference map were calculated by modeling the sensor loop and β7/αC loop from the CK-869/ATP structure in the conformation observed in the 2P9K.pdb structure. CK-869 is labeled and rendered as grey sticks. See also Figure S2 and Table S1.

