
Figure 2.
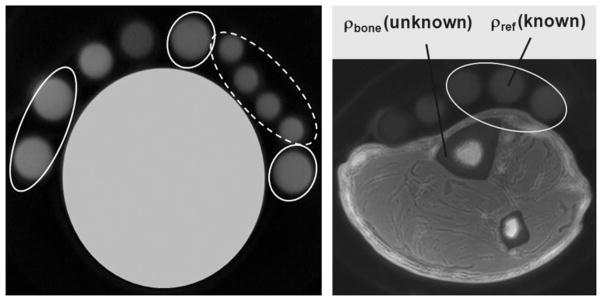
(a) Phantom data from reference samples (20% H2O in D2O doped with 27 mM MnCl2, yielding T1 ~ 15 ms and T2* ~ 320 μs), showing the effect of receive coil inhomogeneity correction in two groups of reference samples; broken line, close mutual proximity; full line, dispersed in different locations. The ratio of the average signal divided by the standard deviation within each group increases substantially after correction: from 15.15 to 32.47 (broken line), and from 7.37 to 32.15 (full line). (b) Three-dimensional hybrid-radial ultra-short echo-time (3D-HRUTE) image (center slice) of tibial mid-shaft with reference samples. This image is corrected for the receive coil shading effect.