
Figure 6.
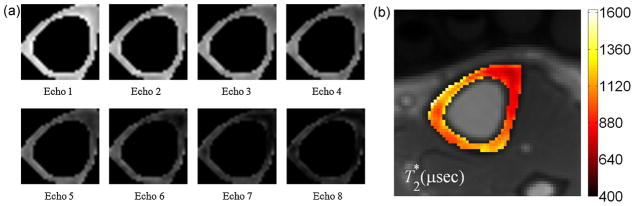
(a) Segmented amplitude images of cortical bone at the tibial mid-shaft as a function of echo-time in a 53-year-old man. The echo-time spans the range 250–1650 μs in equal increments of 200 μs; (b) parametric T2* map superimposed on the anatomic image (mean and standard deviation, 840 ± 230 μs).