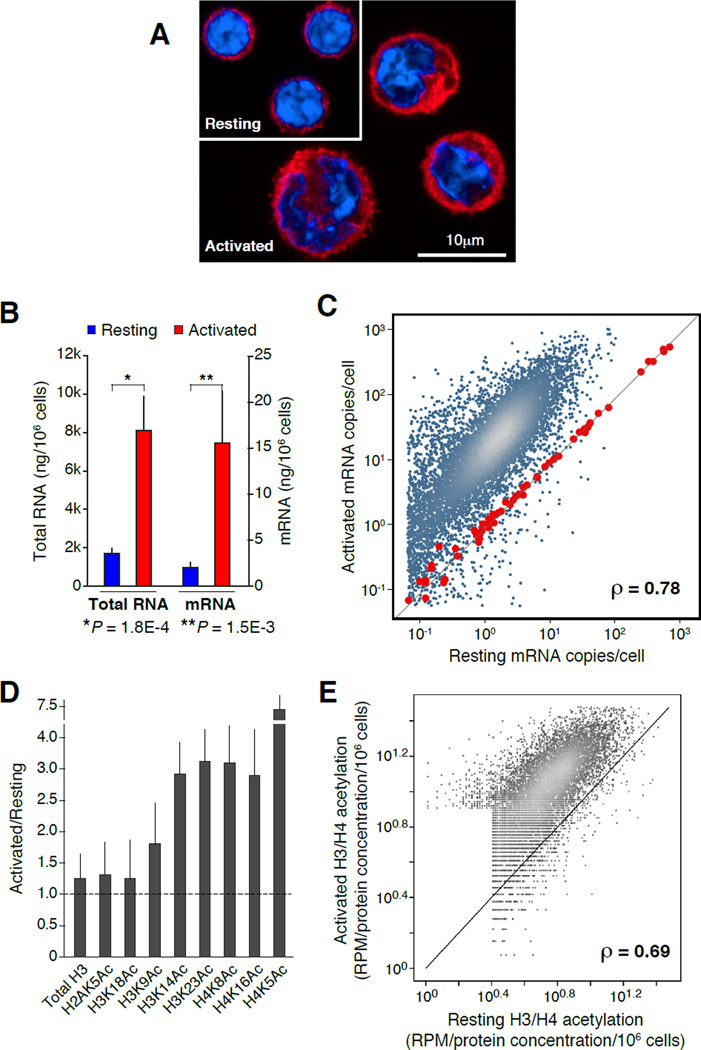
Figure 1. Proportional upregulation of mRNA synthesis and histone acetylation during B cell activation.
(A) Confocal micrograph showing representative examples of resting (G0) and activated (cycling plasmacytes) B cells. Samples were stained with anti-β-tubulin (red) and DAPI (blue). (B) Bar graph portraying total RNA (isolated with TRIzol reagent) and mRNA (isolated with oligo(dT) microbeads) from resting (blue bars) and activated (red bars) B lymphocytes (measured as ng/106 cells). Data are represented as mean +/− SEM (n = 4). (C) Comparison of resting and activated B cell transcriptomes, as determined by mRNA-Seq analysis. Values represent mRNA copies per cell, calculated based on mRNA standards (red dots) spiked-in to total RNA isolated from 106 resting or activated B cells. (D) Reverse phase protein microarray analysis of histone H3 and H4 lysine acetylation marks during B cell activation. Bars represent the ratio of total acetylation measured in activated versus naïve cells. Total histone H3 was used as “loading” control. Data are represented as mean +/− SEM (n = 4). (E) Comparison of histone H3 (K14, K23) and H4 (K5, K8, K16) acetylation in resting and activated B cells as measured by ChIP-Seq and normalized using RPMA values (panel D). Correlation in panels C and E was calculated via Spearman’s ρ.

