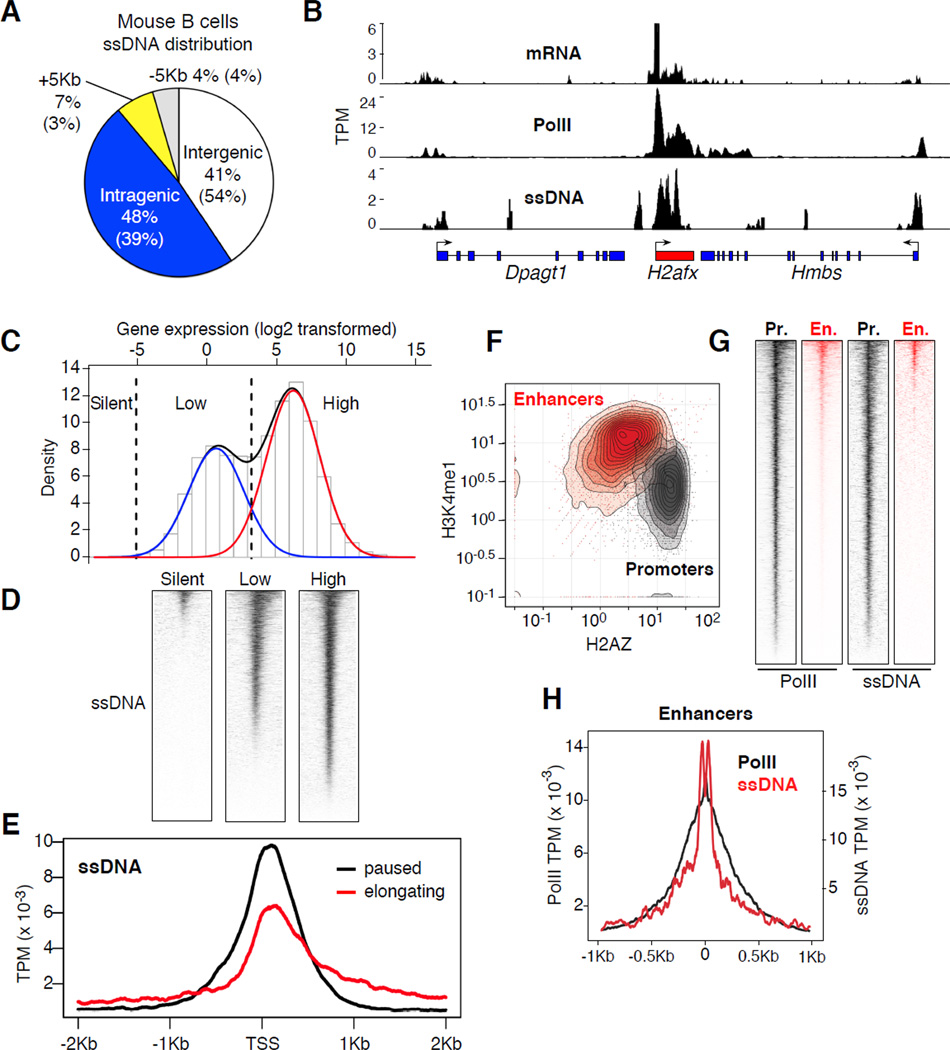
Figure 4. ssDNA-Seq profiles in primary B cells.
(A) Distribution of ssDNA signals in primary LPS+IL4 activated B cells. (B) Correlation between mRNA transcripts, PolII recruitment, and ssDNA at Dpagt1, H2afx, and Hmbs genes. Data represented as sequence tags per million (TPM). (C) Bimodal distribution of gene expression in activated B cells. Red and blue lines delineate first and second components respectively. Black dashed lines demarcate the threshold for highly expressed, low expressed, and silent genes. (D) Heat map of ssDNA-Seq profiles around TSSs (+/− 2Kb) for high, low, and silent gene groups defined in panel C. (E) ssDNA composite alignment at elongating (1 ≤ Pi ≤ 3, red line) and paused (Pi ≥ 10, black line) genes. (F) Density graph, p300+ islands associated with enhancers (H3K4me1highH2AZlow) or promoters (H3K4me1lowH2AZhigh). Data was normalized as fold enrichment. (G) Heat maps showing PolII and ssDNA at p300+ promoter (grey) or enhancers (red). (H) Alignment of PolII (black line, left y-axis) and ssDNA (red line, right y-axis) at p300+H3K4me1highH2AZlow enhancers.

