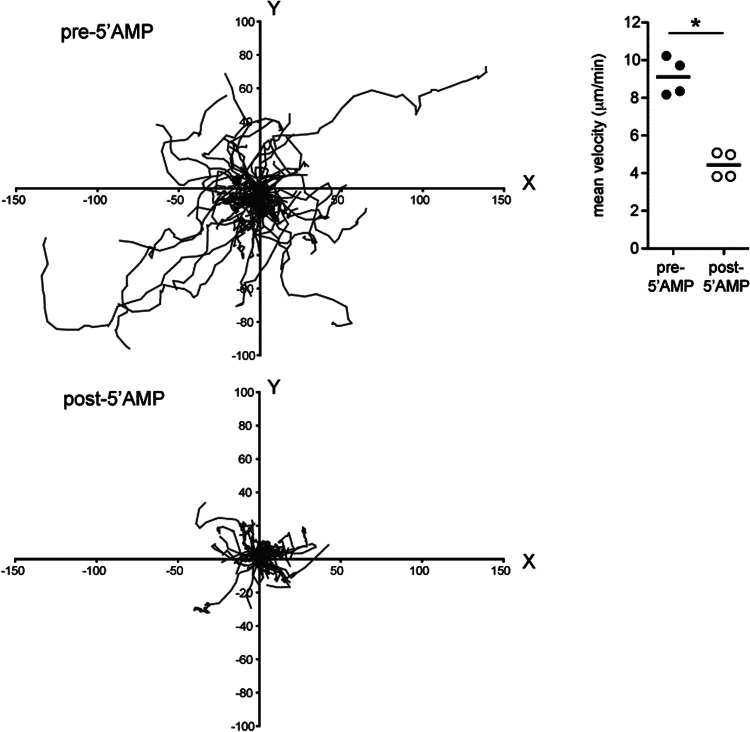
Figure 6. In vivo decrease in motility of T lymphocytes within the LN following 5′-AMP-induced torpor.
Tracks of 75 CD4 T cells in the inguinal LN, prior to and following torpor induction by 5′-AMP (7.5 mmol/kg) administration in mice kept at a body temperature of ∼35°C. x and y coordinates (given in μm) are shown for each cell, normalized such that all starting coordinates are set at 0,0 (left). Summary of mean velocity of CD4 and CD8 T cells in mice prior to and following 5′-AMP injection. Data points represent mean of 80–670 T cell tracks from four mice and two independent experiments (right); *P < 0.05.

