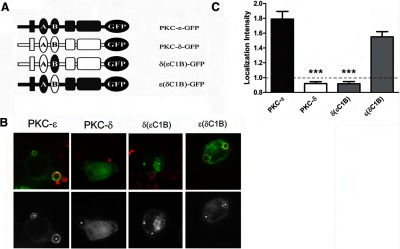
Figure 6. εC1B is not sufficient for PKC translocation to IgG-containing phagosomes.

RAW 264.7 cells were transfected with plasmids encoding the indicated GFP-conjugated proteins (A) and subjected to synchronized phagocytosis. (B) Representative images showing red BIgG (upper); the same image represented in gray scale (lower). Asterisks designate phagosomes. (C) LI was calculated as detailed in Materials and Methods. Data are presented as mean ± sem (80 events for each construct; three to four experiments). Significance was determined by ANOVA with Tukey's post-test; ***P < 0.001 compared with PKC-ε-expressing cells. Dotted line indicates no concentration (i.e., GFP intensity at phagosomes equivalent to that of uninvolved membrane).
