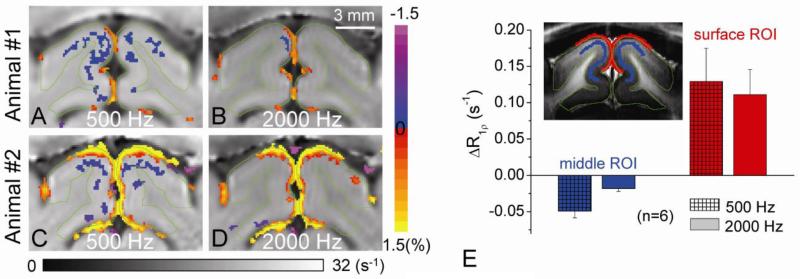
Fig 4. Functional tissue R1ρ changes at two spin-locking frequencies.
Visual stimulation-induced tissue R1ρ changes were measured after 5 mg/kg MION for two SL frequencies ω1 = 500 and 2000 Hz. Tissue R1ρ change maps of two representative animals were shown for ω1 = 500 Hz (A, C) and 2000 Hz (B, D), where the horizontal grayscale bar indicates the baseline R1ρ values and the vertical color bar indicates the functional change. The R1ρ decrease at the parenchyma is significantly reduced for ω1 = 2000 Hz, whereas the R1ρ increasing pixels at the surface of the cortex are similar for the two frequencies. The averaged change (n = 6 cats) in tissue R1ρ at ω1 = 500 Hz is 2.7 times larger than that at 2000 Hz (E).

