Figure.
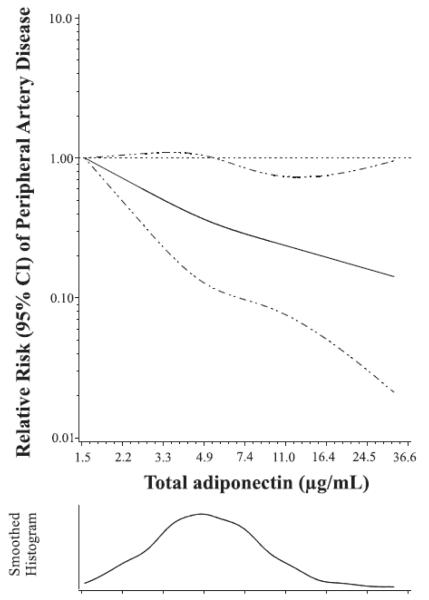
Dose-response relationship between total adiponectin and relative risk of peripheral artery disease (PAD).
Figure depicts the adjusted relative risk of PAD as a function of natural log-transformed plasma adiponectin concentrations which were then back-transformed to the original values for ease of interpretation. Data are fitted by a spline conditional logistic regression model with three knots. Age, smoking status, fasting status and date of blood sampling were matching variables. The model is adjusted for high-density lipoprotein cholesterol, low-density lipoprotein cholesterol, C-reactive protein, cystatin C, pack-years of smoking, history of type 2 diabetes, history of hypertension, and history of hypercholesterolemia, parental history of myocardial infarction before age 60 y, body mass index, and physical activity. The 95% confidence interval is indicated by the dashed lines.

