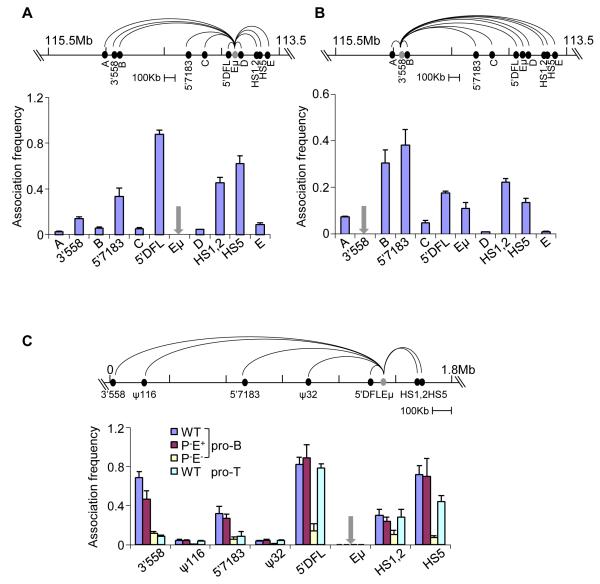
Figure 3. 3C analyses of Eμ-interacting regions.
Quantitative 3C analyses in D345 pro-B cells using different anchors (grey) as indicated. Taqman probes for detection of amplicons were located close to the anchor primers. Data with Eμ (A) and 3′558 (B) anchor primers are shown (additional 3C studies with 5′7183 and HS5 anchors are in Figure S3A and B). Association frequency (Y axis) between two primers was normalized to long-range 3′HS1 interaction in the ß-globin locus; grey arrows mark the site of anchor primers in the bar graphs. Data shown is the average of three independent 3C experiments, with error bars representing the standard error of mean between experiments.
(C) Quantitative 3C analyses using primary bone marrow pro-B cells and thymocytes that carry IgH alleles of the indicated genotypes (all cells were obtained from RAG2-deficient background). Coordinates of the IgH locus in the 129 strain (Simpson et al., 1997) are shown on the top line with positions of the relevant sequences identified by 4C. 3C assays were carried out using anchor primer was used in combination with primers located near HS1,2, HS5, 5′DFL, 5′7183 and 3′558; the ψ116 and ψ32 sequences served as negative controls. Amplification products were detected using a Taqman probe located close to the Eμ anchor primer. The association frequency (Y axis) between two primers was normalized to long-range 3′HS1 interaction in the ß-globin locus (Figure S3C). Data shown is the average of three independent 3C experiments in each genotype; error bars represent the standard error of mean between experiments.

