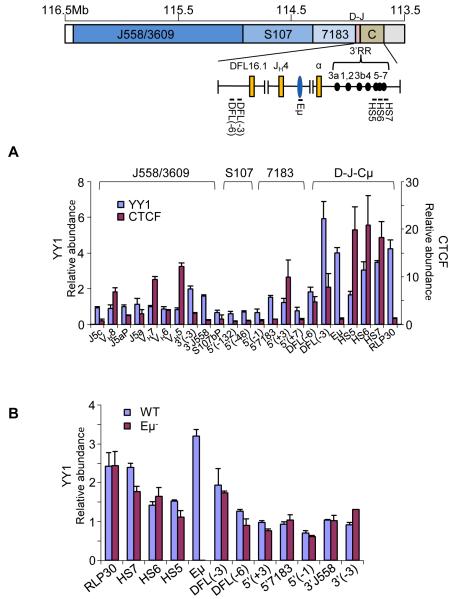
Figure 5. Interaction of YY1 with Eμ-interacting sequences.
(A) Chromatin immunoprecipitations were carried out with anti-YY1 and anti-CTCF antibodies using D345 pro-B cells. ChIP primers from the 3′ region of the IgH locus used are shown on the top line. VH primers assay gene families noted above the bar graph. The relative abundance of specific amplicons in the immunoprecipitate compared to input DNA is shown on the Y axis. Y axis scales differ for YY1 ChIP (left) and CTCF ChIP (right). RPL30 is a positive control for YY1 binding (Liu et al., 2007). HS5-7 correspond to amplicons located within these DNase I hypersensitive sites in the 3′RR, DFL(-3) and DFL(-6) amplicons are located 3 and 6 kb 5′ of DFL16.1, amplicons near 5′7183 and 3′558 are indicated. Data shown is the average of three independent ChIP experiments with each antibody; error bars represent the standard deviation between experiments. See also Figure S4.
(B) Chromatin immunoprecipitation was carried out with anti-YY1 antibody using RAG2-deficient pro-B cell lines carrying WT and Eμ− IgH alleles. Amplicons are as noted in part A. Error bars represent the standard deviation between three independent experiments.

