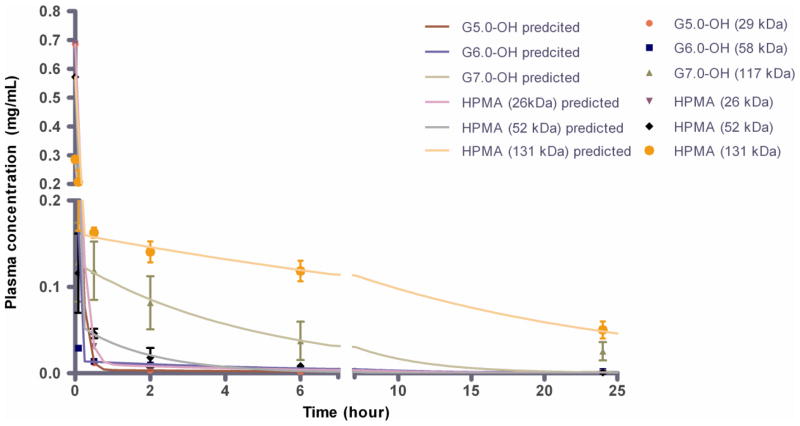
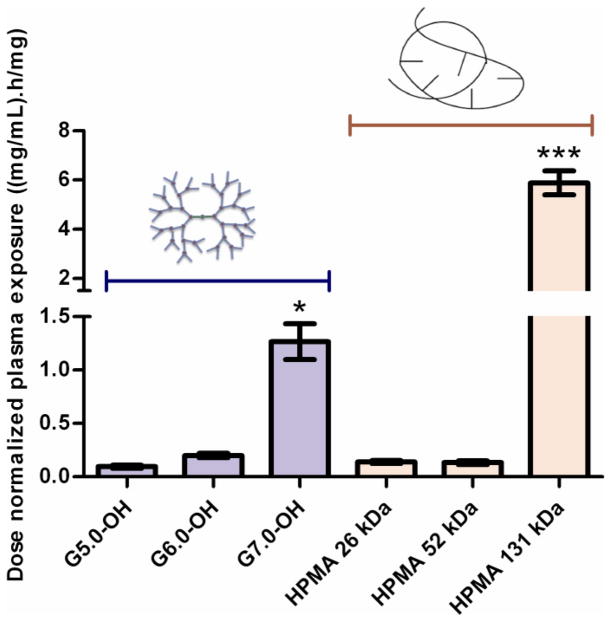
Figure 3.
A. Plasma concentration profile of PAMAM-OH dendrimers and HPMA copolymers with time. Experimental data is represented in symbols-mean ± SEM. Model predicted best fit values are represented as a line. Reprinted (Adapted) with permission from [17], Copyright (2011) American Chemical Society. B. Dose normalized plasma exposure (0–24 h) of PAMAM-OH dendrimers and HPMA copolymers. Data is represented as mean estimate ± standard error of fit. Dose normalized plasma exposure of G7.0-OH and HPMA 131 kDa is statistically significantly different from lower MW polymers with p<0.5 and p<0.001 respectively.


