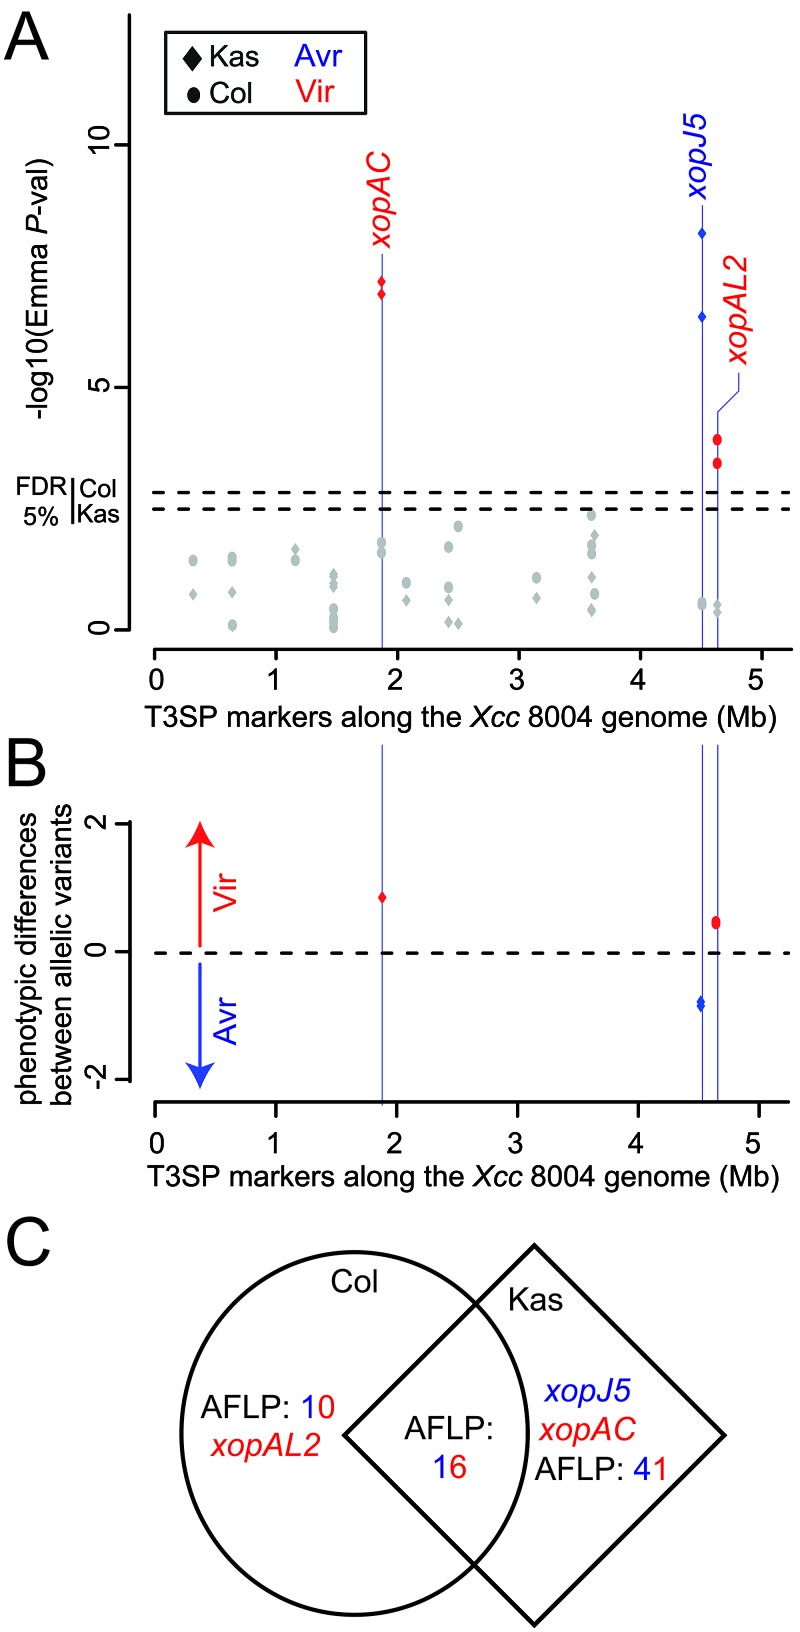
FIG 3 .
Association study results 7 days after inoculation on Col-0 (dots) and Kas (diamonds) plants. (A) Negative log10 of the P values from an association test of the effector markers along the chromosome of the X. campestris pv. campestris 8004 reference strain. (B) Average phenotypic differences measured at each significant effector. The significant markers (FDR at 5%) and their respective effects are in red (pathogenicity effect) or blue (avirulence effect). Dashed lines indicate q values (minimum FDR adjusted p-value at which the test may be called). (C) The overlap between the AFLP and T3SP markers associated with gain (red) or loss (blue) of pathogenicity in Col-0 and Kas plants is represented using a Venn diagram. Avr, avirulent; Vir, virulent.

