

Abstract
Controlled human malaria infection is used to measure efficacy of candidate malaria vaccines before field studies are undertaken. Mathematical modeling using data from quantitative polymerase chain reaction (qPCR) parasitemia monitoring can discriminate between vaccine effects on the parasite's liver and blood stages. Uncertainty regarding the most appropriate modeling method hinders interpretation of such trials.
We used qPCR data from 267 Plasmodium falciparum infections to compare linear, sine-wave, and normal-cumulative-density-function models. We find that the parameters estimated by these models are closely correlated, and their predictive accuracy for omitted data points was similar. We propose that future studies include the linear model.
Keywords: clinical trial, malaria, modeling, Plasmodium falciparum, qPCR, vaccine
Preliminary efficacy screening of candidate malaria vaccines using controlled human malaria infection (CHMI) with the bites of Plasmodium falciparum–infected mosquitoes is well established. It allows vaccine developers to rapidly optimize vaccination regimens, and then to prioritize candidates for more expensive and time-consuming efficacy trials in the field [1]. Following CHMI, many groups undertake quantitative polymerase chain reaction (qPCR) monitoring of volunteers’ parasite density during the “subpatent” period prior to microscopic detection of parasites [2, 3]. A variety of mathematical models have been used to analyze these data to estimate vaccine effects on the liver-to-blood parasite inoculum (LBI) and asexual blood-stage parasite multiplication rate (PMR) [4–7]. The reliability and comparability of these methods are unknown, despite the fact that they may have a critical role in evaluating vaccine efficacy.
Alongside sterilizing immunity in some volunteers, pre-erythrocytic vaccines may produce nonsterile partial protection, reflected by a reduction in LBI in vaccinees relative to controls and a delay in time to diagnosis. Asexual blood-stage vaccines (BSVs) may reduce the blood-stage PMR in vaccinees relative to controls, and may also result in pre-erythrocytic efficacy (ie, reducing the LBI), due to expression of classical “blood-stage” antigens during the late liver stage or on the sporozoite. The ability to measure and distinguish these 2 types of vaccine effect can guide vaccine developers’ selection and optimization of vaccination regimens.
The main types of models that have been used for this purpose are as follows: simple exponential growth [5]; sine-wave–based functions, as originally developed in studies of malaria therapy for neurosyphilis [4, 8]; and a waveform based on the cumulative density function (CDF) of the normal distribution (“normal-CDF based”) [6]. A World Health Organization–convened meeting to discuss challenge trial endpoints highlighted the lack of consensus regarding which modeling method should be used, and recommended that both sine-wave and normal-CDF–based models should be used until this uncertainty can be resolved [9].
Here, we present qPCR data covering at least 1 full parasite lifecycle from 267 subjects who have undergone sporozoite CHMI in Oxford, UK, in order to compare different mathematical models. We restricted our analysis to models capable of providing individual-level estimates of both LBI and PMR. We have not included more complex models designed to address variation in the parasite population or host responses over periods of microscopically patent growth [10, 11]. We compare the reproducibility of LBI and PMR estimates produced by the different models, and the models’ accuracy in predicting omitted data points.
METHODS
Studies and qPCR
Data were drawn from all qPCR-monitored sporozoite CHMI trials conducted in Oxford up to December 2011, including 14 different CHMI studies involving 301 volunteers, 6 of whom were rechallenged on a subsequent occasion. As set out in Supplementary Table 1, the SybrGreen-based qPCR method of Andrews [2] was used for the first 9 challenge studies. For the 5 most recent challenge studies, a second qPCR method was used, based on TaqMan probes, as described elsewhere [3, 12, 13].
With the exception of 2 false-positive results obtained using the previous SybrGreen assay, no qPCR-positive data points were obtained for volunteers who were sterilely protected by a vaccine. These volunteers provided no data for the current study. We considered the absolute minimum quantity of data for modeling to be 2 positive qPCR data points separated by 48 hours. Data meeting this requirement were obtained from a total of 267 infections (104 with the current qPCR method; 163 with the previous method; Supplementary Table 1). Fourteen of these infections resulted from needle-and-syringe administration of cryopreserved NF54 strain sporozoites (Sheehy et al, submitted); all other volunteers were infected by the bites of five 3D7-strain–infected mosquitoes.
To ensure that our conclusions remained valid for volunteers partially protected by pre-erythrocytic vaccines, we performed secondary analyses using the subset of volunteers who developed microscopically-patent parasitemia later than all the nonvaccinated controls in the same challenge study.
Analysis
For each subject, results prior to the first point ≥20 parasites per milliliter (p/mL) were treated as missing. All subsequent points <20 p/mL or negative were replaced with 10 p/mL. Modeling was conducted using Stata version 11 (StataCorp, TX); graphs were produced using Stata and Prism 5 (GraphPad Software).
The following methods of LBI and PMR estimation were compared. Further details of the models, including parameter definitions, are described in Table 1. Phrases in parentheses and quotes indicate shorthand subsequently used to refer to each method.
- Exponential model (“linear”):
- log10(PCR) = m(day – 7.5) + c
- Sine-wave model (“sine”) [8]:
- log10(PCR) = c + m(day – 6.5) + a[sin [π*(day – 6.5) + k]
- Normal CDF model (“N-CDF”) [6]:
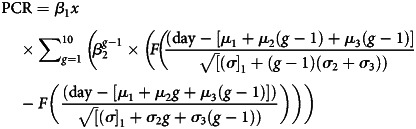
Table 1.
Parasitemia Model Comparisons
| Model | Model Structure | Vaccine-Relevant Estimated Parameters |
Additional Parameters |
||||
|---|---|---|---|---|---|---|---|
| LBI (parasites/mL) | PMR (fold/48 h) | Constant | Gradient | Lifecycle Time Intervals | Synchronicity | ||
| Exponential | Individual volunteer | Fitted value on day 7.5 | 102m | c | m | n/a | n/a |
| Sine-wave | Individual volunteer | 10(|a| + c) | 102m | c | m | 2 day lifecycle duration; k shifts phase of sine wave and could be considered to adjust for variable time of liver release |
a (determines sine wave amplitude) |
| Normal-CDF | Here, fitted to individual volunteer (multilevel modeling with some parameters fitted at group level also possible) | β1x | β2 per (μ2 + 3) days (corrected to fold per 48 h for comparison with other models) |
β1x | β2 | μ1 time to liver release μ2 period a ring remains unsequestered μ3 period between sequestration and reinvasion |
σ12, σ22, σ32
(variances in µ1, µ2, µ3, respectively) |
Abbreviations: CDF, cumulative density function; LBI, liver-to-blood parasite inoculum; n/a, not applicable; PMR, parasite multiplication rate.
In addition, we also examined (1) direct qPCR quantification of LBI using the maximum measured parasite density during the first blood-stage generation (up to day 8.25) as a measure of the LBI (subsequently referred to as “first cycle peak”), and (2) direct qPCR quantification of PMR using the ratios of geometric mean parasitemia in first and second blood-stage parasite lifecycles (“cycle mean ratio”), as previously described [7]. For the latter, we estimated a 40-hour parasite lifecycle (see Supplementary Figure 1B), with the first lifecycle extending to day 8.25, and the second cycle from day 8.25 to day 9.90; data from each cycle were only analyzed if the time of diagnosis for that volunteer was more than half way through the cycle. Data from volunteers who were not parasitemic by qPCR throughout this period could not contribute to this final analysis.
Comparison of Predictive Accuracy of Models
For the 3 approaches that fit a model (linear, sine, and N-CDF), the capacity of the models to predict future parasite density was assessed by fitting each model to each individual's data, omitting the final 2 qPCR points. An out-of-sample forward prediction was then made for the final recorded qPCR point prior to treatment, and the error in this prediction (relative to the actual recorded qPCR value) was calculated. Further assessment of predictive capacity was performed using leave-one-out cross-validation (LOOCV), in which each model was successively refitted to an individual's data with each single data point omitted in turn. The root mean square error (RMSE) of the LOOCV prediction was calculated for each individual. This analysis was performed only for subjects assayed using the more recent (TaqMan-based) qPCR assay.
RESULTS
Clinical Trial qPCR Data
Supplementary Figure 1A demonstrates the accuracy of the TaqMan-based qPCR method, with a coefficient of variation (CV) less than 10% for parasite densities exceeding 40 p/mL, and in the range 10%–100% for parasite densities of 10–40 p/mL. The previous (SybrGreen-based) qPCR assay had a CV of around 50% for parasite densities exceeding 300 p/mL, and 50%–150% for parasite densities of 20–300 p/mL, as previously reported [2]. All trial qPCR data are presented as Supplementary Table 1.
The periodicity of parasitemia over the first 96 hours of blood-stage growth is illustrated by Supplementary Figure 1B and 1C. Troughs in parasitemia are separated by approximately 40 hours (ie, at days 8.25, 9.9, and 11.6), similar to the in vitro lifecycle duration of 3D7 clone parasites.
Models Fit Similar Lines and Produce Similar Parameter Estimates
The correlations between LBI and PMR estimates produced by linear, sine, and normal-CDF models, and by “first cycle peak” and “cycle mean ratio” methods, are shown in Figure 1. Examples of individual model fits are shown in Supplementary Figure 2A and 2C. Using data from the TaqMan-based qPCR method, Spearman correlation coefficients (rs) ranged from 0.95 to 0.99 for estimates of LBI from different methods, and from 0.77 to 0.90 for model-based estimates of PMR (Figure 1). The relationship between “cycle mean ratio” PMR estimates and model-based estimates was somewhat weaker (rs = 0.38–0.52). There were no systematic variations in estimates of LBI or PMR by linear, sine, or N-CDF methods. Correlations between parameter estimates remained strong when considering the subset of 20 volunteers partially protected by pre-erythrocytic vaccines (rS > 0.75 and P < .01 for all comparisons, with the exception of those including the cycle means method, which were not statistically significant).
Figure 1.

Different models produce similar parameter estimates and cross-validation errors. A, Parameter estimates from different models. Upper left: Scatterplot matrix illustrating correlations of LBI estimates from linear, sine, and N-CDF models with each other and with the first cycle peak–measured parasitemia, for studies conducted using TaqMan assay. LBI estimates <2 p/mL are plotted at 2, and >2000 at 2000. Upper right: Scatterplot matrix illustrating correlations of LBI estimates from linear, sine, and N-CDF models with each other and with the first cycle peak–measured parasitemia, for studies conducted using SybrGreen assay. LBI estimates <2 p/mL are plotted at 2, and >2000 at 2000. Lower left: Scatterplot matrix illustrating correlations of PMR estimates from linear, sine, and N-CDF models, and from “cycle mean ratio” method, for studies conducted using TaqMan assay. PMR estimates >30-fold per 48 hours are plotted at 30. Lower right: Scatterplot matrix illustrating correlations of PMR estimates from linear, sine, and N-CDF models, and from “cycle mean ratio” method, for studies conducted using SybrGreen assay. PMR estimates >30-fold per 48 hours are plotted at 30. B and C, Comparison of predictive accuracy of models. (B) Comparison of forward-predictive accuracy of linear, sine, and N-CDF models: fold error in prediction of time-of-diagnosis PCR using data lacking final 2 points. (C) Leave-one-out cross-validation error comparison. For each volunteer, each individual qPCR data point was serially omitted from the model-fitting data set, and errors in the prediction of each point were calculated. Root mean square of individual-point errors was calculated for each volunteer, and antilogged to produce fold-root mean square error as a summary measure for each subject. Abbreviations: N-CDF, normal-CDF; LBI, liver-to-blood parasite inoculum; qPCR, quantitative polymerase chain reaction; PMR, parasite multiplication rate.
On using data from the SybrGreen assay, correlation coefficients for estimates of LBI by different methods were weaker (rs = 0.64–0.92 for LBI and 0.42–0.89 for PMR), and there was a systematically higher estimate of LBI using the sine model compared with the linear or N-CDF models.
We found negative correlations between PMR and LBI estimates within each model (rs = −0.48, −0.41, and −0.58, for linear, since, and N-CDF, respectively; P < .001 for each). We also found that PMR estimates produced by all models correlated negatively with the LBI estimated without modeling from the “first cycle peak” parasite density (Supplementary Figure 2D, rs = −0.30, −0.22, and −0.31 for linear, sine, and N-CDF PMR estimates, respectively; P < .0001 for each).
Predictive Accuracy of Models
Cross-validation approaches assess the capacity of a model to make an accurate prediction of the outcome (dependent) variable for an observation that is omitted from the data set used to fit the model.
The predictive accuracy of the models for omitted data points is shown in Figure 1B and 1C. There was a nonsignificant tendency (P = .34 by Kruskal–Wallis test) for the N-CDF model to be more accurate than the linear or sine models in predicting an omitted final data point in the series, but the N-CDF model was significantly less accurate for omitted data points within the series (P < .0001 by Kruskal–Wallis test). Although statistically significant, this difference was slight in magnitude (Figure 1C). There were no statistically significant differences in the accuracy of either type of prediction among the subset of 20 volunteers partially protected by pre-erythrocytic vaccines (data not shown).
DISCUSSION
The estimates of LBI and PMR returned by these different mathematical models appear to be very similar. The more complex sine and normal CDF models did not achieve improved predictive accuracy for predicting missing data points relative to the simple linear model. There was less agreement between the models when using data from an older, less accurate PCR assay. The quality of the data that are input to the modeling process may be more important than the use of complex models.
Nonmodel-based estimation of LBI is possible. The first peak of parasitemia occurs between days 7 and 8, is probably a good approximation to the true LBI, and correlates closely with model-derived outputs. Enhancement of the sensitivity of qPCR toward 1 or 2 p/mL at these time points may increase the accuracy of “first cycle peak” measurement, and could eliminate the need for follow-up until blood-film positivity for trials where only LBI needs to be estimated. However, PMR cannot be accurately measured from a short period of qPCR monitoring, and a longer period of follow-up (ie, until blood films are positive) will continue to be necessary during evaluation of blood-stage vaccines by CHMI.
We observed an inverse relationship between PMR and LBI. Such a relationship could arise as an artefact (under- or overestimates of LBI would tend to result in converse errors in PMR; for example, if the timing of blood-sampling resulted in an underestimate of the first cycle peak parasitemia). On the other hand, this inverse relationship was observed even when nonmodel-based estimates of LBI were used. It may thus represent a biological effect, such as an effect of LBI on the release of tumor necrosis factor–α, which has been proposed to mediate density-dependent control of parasitemia [15].
Our analysis shows that estimates of individuals’ PMR and/or LBI after mosquito-bite CHMI are reasonably consistent regardless of the model used. The output of 2 previously published models [4, 6] correlate closely, but a far simpler linear model provides estimates of LBI and PMR that closely correlate with both methods. There were minor differences in the predictive accuracy of the 3 models for missing data points. All 3 models correlated with an alternative method of PMR estimation based on mean parasitemia in each asexual lifecycle cycle, and an alternative method of LBI estimation using the first cycle peak. The linear model is simpler to apply to subjects with qPCR-negative data points and short periods of follow-up after an early blood-film diagnosis. Unlike the more complex models, it does not require either the estimation of further vaccine-irrelevant parameters or the use of assumptions that these parameters are fixed across volunteers (see Methods and Table 1). Unlike complex nonlinear models, it produces a single solution (avoiding the potential vulnerability of convergence upon local rather than global minima), and is readily comprehensible. We do not rule out the possibility that more complex models may perform favorably under certain circumstances, and do not intend to discourage the consideration of these and future more complex models; we intend only to suggest that the simple linear technique be reported alongside any other estimates, and that we do not believe that the current data justify the use of the more complex models examined here.
This information will be useful for investigators applying parasite lifecycle modeling to assess vaccine efficacy in CHMI trials, as well as for funders and regulatory agencies attempting to judge the outcome of such trials.
Supplementary Data
Supplementary materials are available at The Journal of Infectious Diseases online (http://jid.oxfordjournals.org/). Supplementary materials consist of data provided by the author that are published to benefit the reader. The posted materials are not copyedited. The contents of all supplementary data are the sole responsibility of the authors. Questions or messages regarding errors should be addressed to the author.
Notes
Acknowledgments. We are grateful for the contributions of the investigators, physicians, and subjects of the clinical trials that generated the data. C. C. Hermsen kindly provided the qPCR primers and probe. The trial of needle-inoculated sporozoites was conducted in collaboration with Sanaria Inc, and we are grateful for the contributions and suggestions of S. L. Hoffman, E. R. James, P. F. Billingsley, and B. K. Sim.
Financial support. This work was supported by the Wellcome Trust Training Fellowships for Clinicians in Basic Sciences (grant numbers 089455/2/09/z and 094449/Z/10/Z to A. D. D. and C. J. A. D.). S. J. D. is a National Institute for Health Research (NIHR) Clinical Lecturer. S. J. D. holds a Medical Research Council (MRC) Career Development Fellowship (grant number G1000527) and is a Jenner Investigator. P. B. is supported by an MRC Clinician Scientist Fellowship (G1002624). A. V. S. H. is a Wellcome Trust and NIHR Senior Investigator at the NIHR Oxford Biomedical Research Centre. Funding for manufacture, quality control release, and stability studies of Sanaria's PfSPZ Challenge was provided by the National Institute of Allergy and Infectious Diseases (http://www.niaid.nih.gov; R44AI058375) “Universal Attenuated Malaria Sporozoite Vaccine and Challenge System.”
Potential conflicts of interest. A. D. D., S. C. G., G. A. O.'H., A. V. S. H., and S. J. D. are named on patent applications relating to malaria vaccines. All other authors report no potential conflicts.
All authors have submitted the ICMJE Form for Disclosure of Potential Conflicts of Interest. Conflicts that the editors consider relevant to the content of the manuscript have been disclosed.
References
- 1.Sauerwein RW, Roestenberg M, Moorthy VS. Experimental human challenge infections can accelerate clinical malaria vaccine development. Nat Rev Immunol. 2011;11:57–64. doi: 10.1038/nri2902. [DOI] [PubMed] [Google Scholar]
- 2.Andrews L, Andersen RF, Webster D, et al. Quantitative real-time polymerase chain reaction for malaria diagnosis and its use in malaria vaccine clinical trials. Am J Trop Med Hyg. 2005;73:191–8. [PubMed] [Google Scholar]
- 3.Hermsen CC, Telgt DS, Linders EH, et al. Detection of Plasmodium falciparum malaria parasites in vivo by real-time quantitative PCR. Mol Biochem Parasitol. 2001;118:247–51. doi: 10.1016/s0166-6851(01)00379-6. [DOI] [PubMed] [Google Scholar]
- 4.Bejon P, Andrews L, Andersen RF, et al. Calculation of liver-to-blood inocula, parasite growth rates, and preerythrocytic vaccine efficacy, from serial quantitative polymerase chain reaction studies of volunteers challenged with malaria sporozoites. J Infect Dis. 2005;191:619–26. doi: 10.1086/427243. [DOI] [PubMed] [Google Scholar]
- 5.Cheng Q, Lawrence G, Reed C, et al. Measurement of Plasmodium falciparum growth rates in vivo: a test of malaria vaccines. Am J Trop Med Hyg. 1997;57:495–500. doi: 10.4269/ajtmh.1997.57.495. [DOI] [PubMed] [Google Scholar]
- 6.Hermsen CC, de Vlas SJ, van Gemert GJ, Telgt DS, Verhage DF, Sauerwein RW. Testing vaccines in human experimental malaria: statistical analysis of parasitemia measured by a quantitative real-time polymerase chain reaction. Am J Trop Med Hyg. 2004;71:196–201. [PubMed] [Google Scholar]
- 7.Roestenberg M, de Vlas SJ, Nieman AE, Sauerwein RW, Hermsen CC. Efficacy of preerythrocytic and blood-stage malaria vaccines can be assessed in small sporozoite challenge trials in human volunteers. J Infect Dis. 2012;206:319–23. doi: 10.1093/infdis/jis355. [DOI] [PubMed] [Google Scholar]
- 8.Simpson JA, Aarons L, Collins WE, Jeffery GM, White NJ. Population dynamics of untreated Plasmodium falciparum malaria within the adult human host during the expansion phase of the infection. Parasitology. 2002;124:247–63. doi: 10.1017/s0031182001001202. [DOI] [PubMed] [Google Scholar]
- 9.Moorthy VS, Diggs C, Ferro S, et al. Report of a consultation on the optimization of clinical challenge trials for evaluation of candidate blood stage malaria vaccines, 18–19 March 2009, Bethesda, MD, USA. Vaccine. 2009;27:5719–25. doi: 10.1016/j.vaccine.2009.07.049. [DOI] [PubMed] [Google Scholar]
- 10.Dietz K, Raddatz G, Molineaux L. Mathematical model of the first wave of Plasmodium falciparum asexual parasitemia in non-immune and vaccinated individuals. Am J Trop Med Hyg. 2006;75:46–55. doi: 10.4269/ajtmh.2006.75.46. [DOI] [PubMed] [Google Scholar]
- 11.Recker M, Buckee CO, Serazin A, et al. Antigenic variation in Plasmodium falciparum malaria involves a highly structured switching pattern. PLOS Pathog. 2011;7:e1001306. doi: 10.1371/journal.ppat.1001306. [DOI] [PMC free article] [PubMed] [Google Scholar]
- 12.Wang CW, Hermsen CC, Sauerwein RW, Arnot DE, Theander TG, Lavstsen T. The Plasmodium falciparum var gene transcription strategy at the onset of blood stage infection in a human volunteer. Parasitol Int. 2009;58:478–80. doi: 10.1016/j.parint.2009.07.004. [DOI] [PubMed] [Google Scholar]
- 13.Sheehy SH, Duncan CJ, Elias SC, et al. ChAd63-MVA-vectored blood-stage malaria vaccines targeting MSP1 and AMA1: assessment of efficacy against mosquito bite challenge in humans. Mol Ther. 2012;20:2355–68. doi: 10.1038/mt.2012.223. [DOI] [PMC free article] [PubMed] [Google Scholar]
- 14.Spring MD, Cummings JF, Ockenhouse CF, et al. Phase 1/2a study of the malaria vaccine candidate apical membrane antigen-1 (AMA-1) administered in adjuvant system AS01B or AS02A. PLOS ONE. 2009;4:e5254. doi: 10.1371/journal.pone.0005254. [DOI] [PMC free article] [PubMed] [Google Scholar]
- 15.Kwiatkowski D. Malarial toxins and the regulation of parasite density. Parasitol Today. 1995;11:206–12. doi: 10.1016/0169-4758(95)80079-4. [DOI] [PubMed] [Google Scholar]
Associated Data
This section collects any data citations, data availability statements, or supplementary materials included in this article.