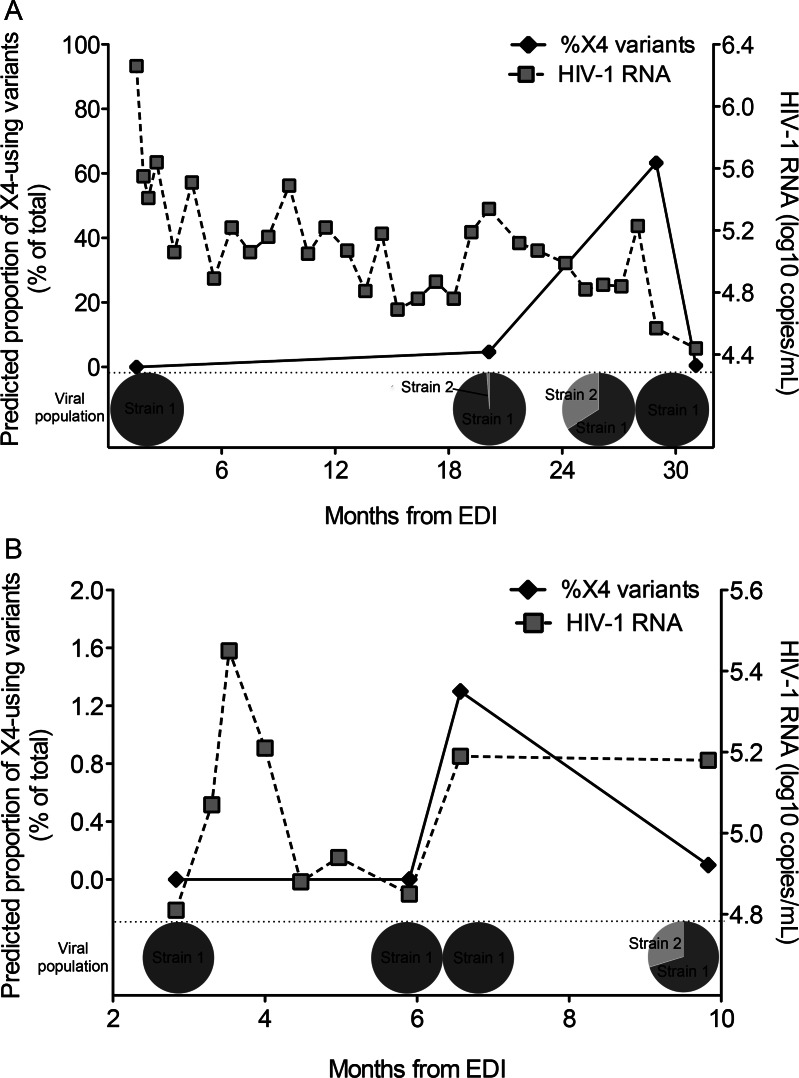
Figure 2.
HIV-1 superinfection and inferred X4 coreceptor usage over time. In case G59 A, an increase in the proportion of X4 usage (black solid diamonds) coincided with the detection of a superinfecting strain (pie charts), and X4 variants disappeared when this strain was no longer detected. In case L78 B, low-level detection of X4 usage occurred right before detection of the superinfecting strain, and decreased below 1% when the second strain was detected. HIV-1 RNA viral load (gray squares) over time for each participant is superimposed. Abbreviations: EDI, estimated date of infection; HIV-1, human immunodeficiency virus type 1; X4 usage, viral population with >1% X4 variants detected at a false positive rate of 5%.

