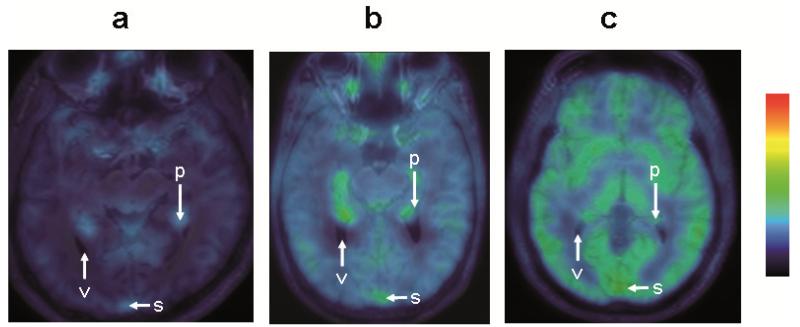
Figure 2.
Representative transaxial MRIs merged with (R)-[11C]verapamil PET summation images (0-40 min) for a baseline scan (a, taken from reference (17)) and scans after administration of tariquidar at a dose of 3 mg/kg (b) and 8 mg/kg (c). Activity concentration is expressed as standardized uptake value (SUV) and radiation scale is set from 0.1 to 3.0. Anatomical structures are labeled using white arrows (v, ventricle; p, choroid plexus; s, venous sinus).

