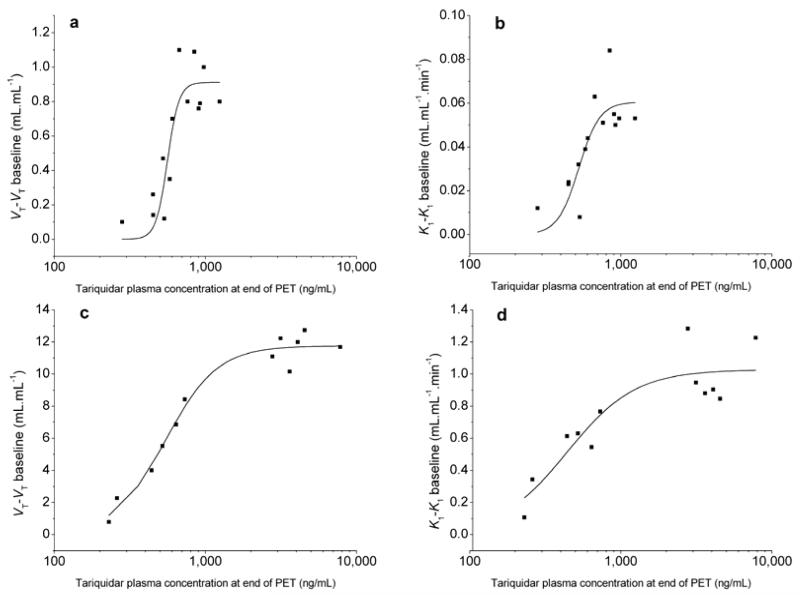
Figure 4.
Relationship between tariquidar plasma levels (ng/mL) at the end of the PET scan and (R)-[11C]verapamil whole brain volume of distribution VT-VT at baseline and influx rate constant K1-K1 at baseline derived from 2-tissue-4-rate constant compartment model from 0-40 min in humans (a, b) and from 0-60 min in Sprague-Dawley rats (c,d) (19) and corresponding sigmoidal fits using the Hill function.

