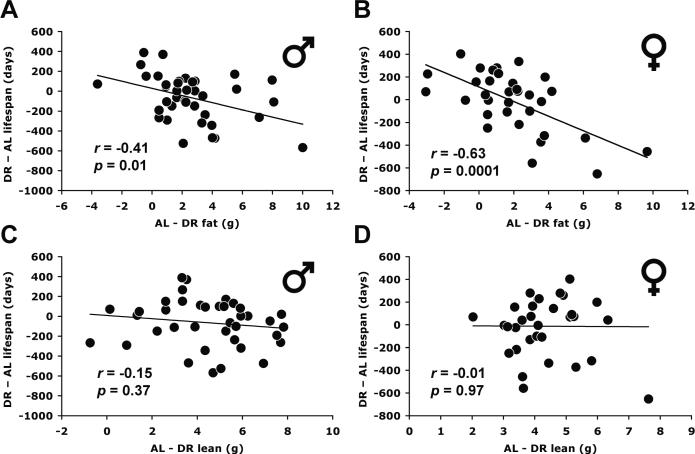
Fig. 4.
Correlation between fat reduction and lifespan modulation under 40% dietary restriction (DR). X-axis: fat (or lean) reduction was measured by subtracting fat (or lean) mass under DR from fat (or lean) mass under AL feeding for each strain. Y-axis: lifespan modulation was measured by subtracting mean lifespan under AL from mean lifespan under DR (Liao et al., 2010a). Fat and lean mass were derived from 15–17 months of age. Reduction in lean body mass was not correlated with differential lifespan (C: males; D: females). The lines represent linear regression. The P values of the Pearson correlation coefficients (r) are all from 2-tailed tests.

