
Figure 1.
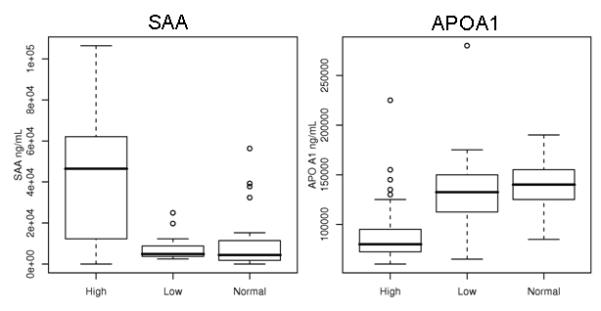
Box plots showing the plasma concentrations (mg/ml) of A. SAA and B. APOA1 in High (HRNB), Low (LRNB) and Normal (HC) groups. The box represents values between the 25th and 75th percentile with the horizontal line indicating the median value. ° indicates outlier values.