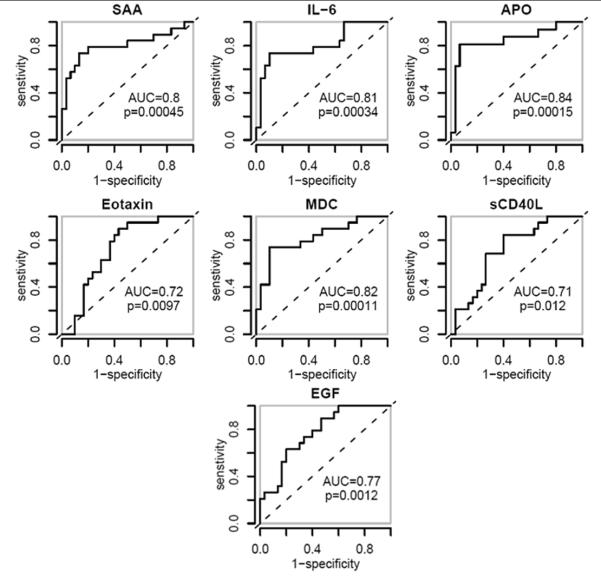
Figure 2.
Receiver Operating Characteristic (ROC) analysis of the seven proteins used in the HRNB classifier for the training set samples. A higher Area Under the ROC Curve (AUC) value indicates increased accuracy for a given marker to predict the presence of HRNB. The p-value of the each of the classification is also indicated. For the biomarkers (Eotaxin, MDC, SCD40L and EGF) that were lower in the high-risk neuroblastoma group, the concentration values multiplied by −1 were used to generate the ROC plots.

