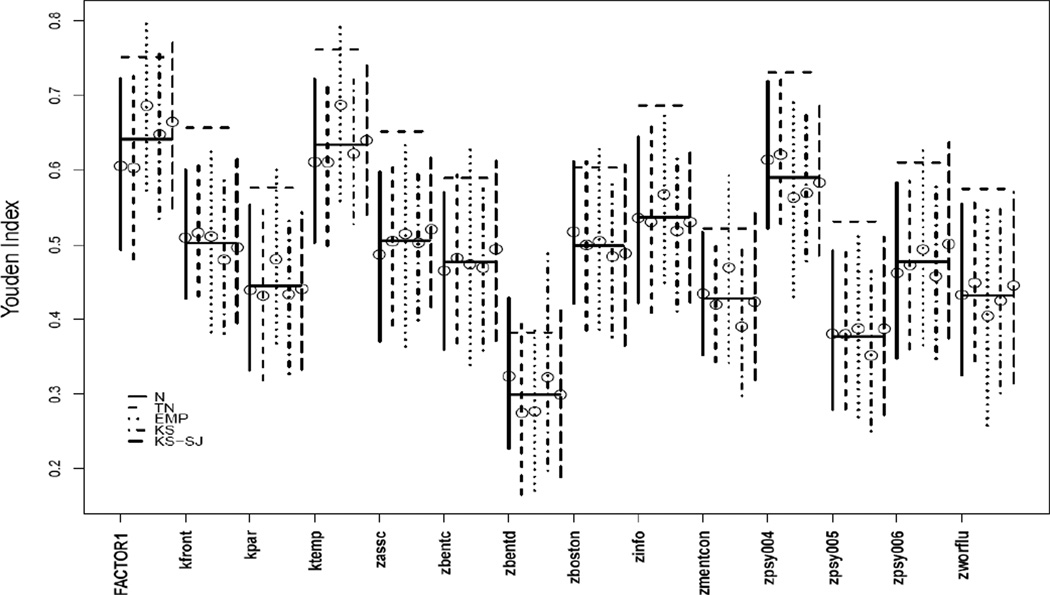
Figure 1.
Youden index and VUS for 14 psychometric markers of AD: For each marker, estimates on J (indicated by circle) under the five methods (N, TN, EMP, KS, KS-SJ) are plotted with 95% CIs (vertical lines); the solid horizontal line is the average estimates on J across all methods; the dashed horizontal line is the average of VUS estimate under normal method and by empirical estimation.

