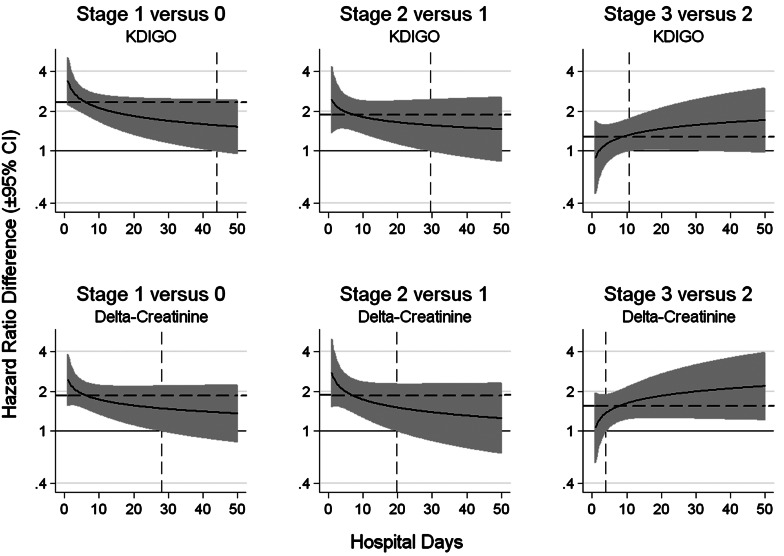
FIGURE 2:
Comparison of HRs of death for successive AKI stages using KDIGO and Delta-Creatinine systems. Each panel depicts the time-dependent HRs (solid lines ± 95% confidence interval) comparing successive AKI stages with the KDIGO stages in the top panels and the Delta-Creatinine categories shown in the bottom panels. The horizontal lines at HR = 1 represents equality between AKI stages. The vertical dashed line represents the time point where the 95% CI of the difference in HRs falls below or rises above HR = 1. The dashed horizontal lines indicate time-invariant HRs obtained using Cox proportional hazard multivariable regression models, adjusted for age, race and gender.

