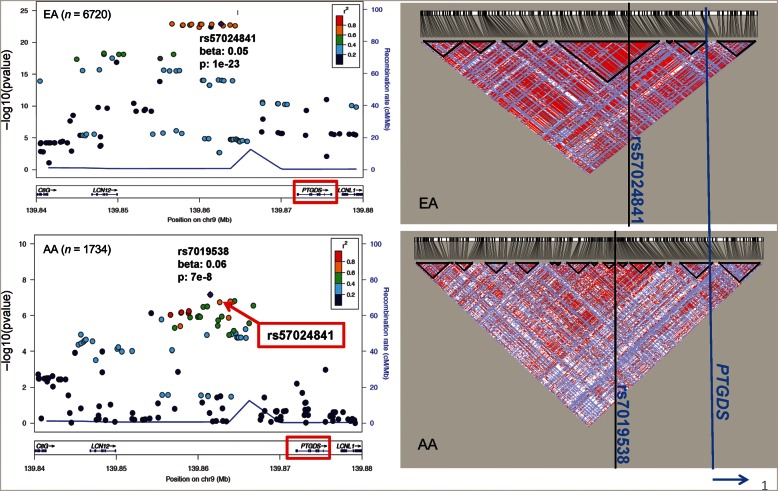
FIGURE 2:
Genetic association and LD patterns at the PTGDS locus using imputed dosage from the 1000 Genomes reference panels in EAs and AAs. The Haploview plots on the right show the D' measures between SNPs in the same region as the regional association plots on the left. The positions of the index SNPs and the PTGDS gene are marked with vertical lines in the Haploview plots.

