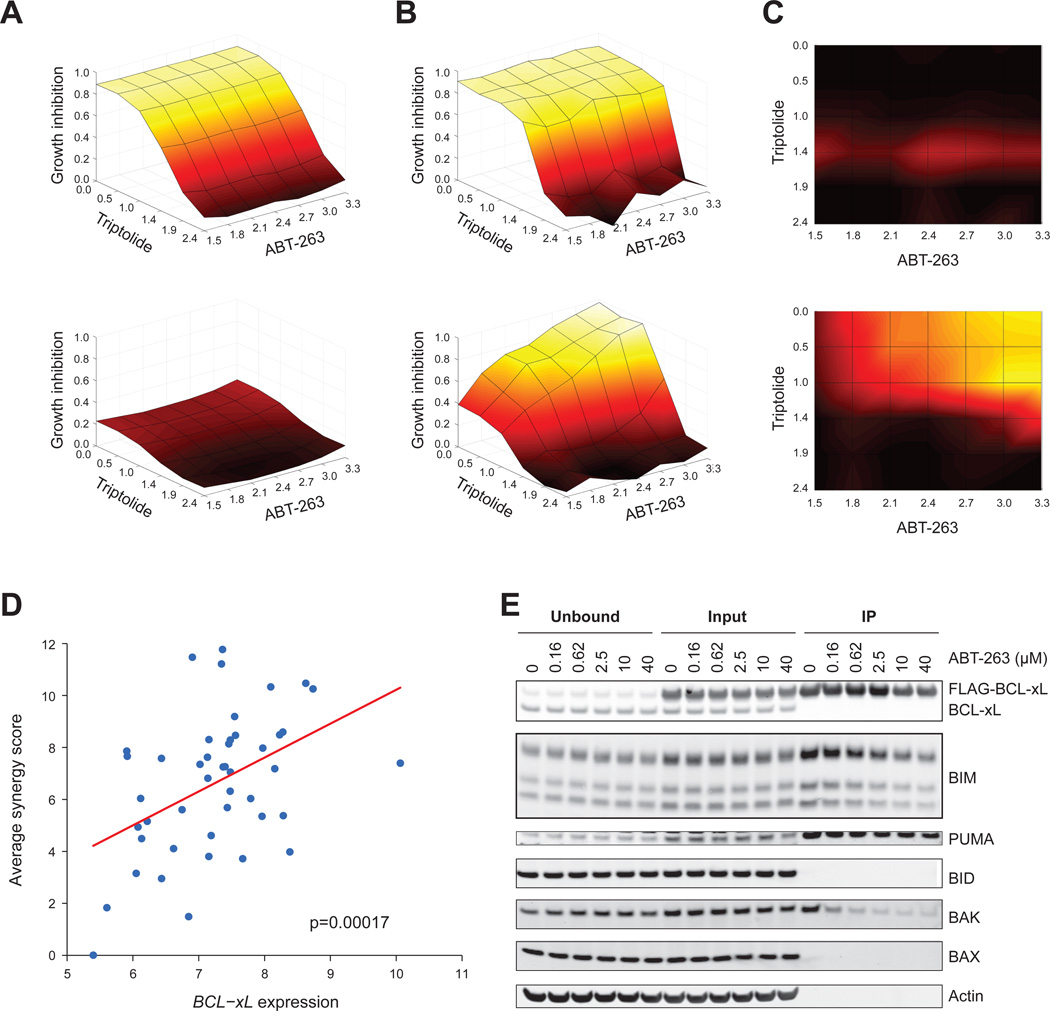
Figure 8. TR compounds and BCL-xL inhibitor compounds synergistically killed cells with high BCL-xL expression.
A-C. Example of synergy calculation. Cell lines expressing BCL-xL at the lowest (NCI-H23, top panel) and highest (SKLU1, bottom panel) levels, across a panel of 74 NSCLC cell lines.
A. Bliss Independence model. Dose-response curves for single-agent treatment with ABT-263 and triptolide were used to compute the null-hypothesis surface of expected response to combination treatment with ABT-263 and triptolide using a Bliss independence model. The xand y-axis represent concentrations of ABT-263 and triptolide in log10(nM), and the z-axis (as well as the color scale) represents the expected percent growth inhibition for each combination of compound concentrations under the null hypothesis model.
B. Dose response matrix. Observed response surfaces for the combination experiments were plotted.
C. Excess over Bliss independence. Excess percent growth inhibition over the null hypothesis model was computed for each combination of compound concentrations by subtracting the growth inhibition values displayed in (A) from those in (B). Black represents no excess growth inhibition and yellow represents excess growth inhibition (scale 0 to 1).
D. BCL-xL expression level versus compound synergy across the panel of 74 cell lines. The x-axis displays the log2 expression level of BCL-xL. The y-axis displays the synergy score, computed by summing the excess over bliss independence values (as shown in C) over all combinations of compound concentrations. The synergy scores displayed in the plot represent the average synergy score over the 4 combination experiments, performed by pairing triptolide or actinomycin D with ABT-263 or ABT-737.
E. Cells stably expressing FLAG-tagged BCL-xL were treated with ABT-263 at indicated concentrations for 3 hours, and subjected to immunoprecipitation with an anti-FLAG antibody beads, and eluted with 3X FLAG peptides. The IP fraction was 5-fold more concentrated than input and unbound.

