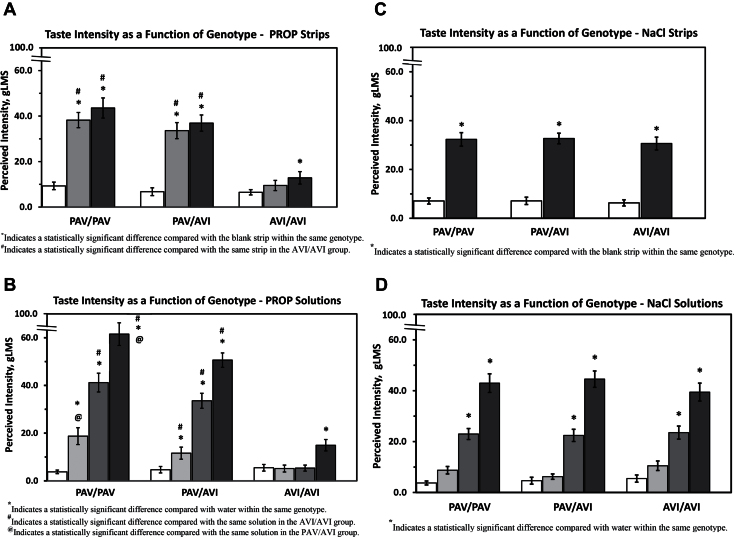
Figure 1.
Suprathreshold taste intensity response as a function of TAS2R38 genotype. Error bars represent standard error of the mean. (A) Taste intensity responses to 400 and 600nmole PROP strips. Clear columns represent blank strips, gray columns represent 400nmole PROP strips, and black columns represent 600nmole PROP strips. (B) Taste intensity responses to 0.032, 0.32, and 3.2mM PROP solutions. Clear columns represent water controls, light gray columns represent 0.032mM PROP, dark gray columns represent 0.32mM PROP, and black columns represent 3.2mM PROP. (C) Taste intensity responses to a 140 umole NaCl strips. Clear columns represent blank strips, and black columns represent 140umole NaCl strips. (D) Taste intensity responses to 0.01, 0.1, and 1.0M NaCl solutions. Clear columns represent water controls, light gray columns represent 0.01M NaCl, dark gray columns represent 0.10M NaCl, and black columns represent 1.0M NaCl. The same subject population was used in all figures (n = 108).

