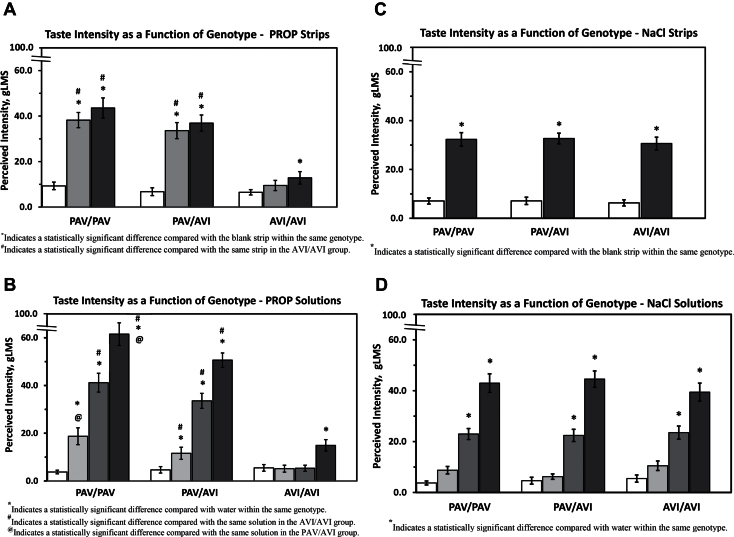
Figure 2.
Hedonic response to taste stimuli as a function of TAS2R38 genotype. Data are plotted as the percentage of respondents who reported a response of dislike. (A) Hedonic responses to 400 and 600nmole PROP taste strips. Clear columns represent blank strips, gray columns represent 400nmole PROP strips, and black columns represent 600nmole PROP strips. (B) Hedonic responses to 0.032, 0.32, and 3.2mM PROP solutions. Clear columns represent water controls, light gray columns represent 0.032mM PROP, dark gray columns represent 0.32mM PROP, and black columns represent 3.2mM PROP. (C) Hedonic responses to a 140umole NaCl strip. Clear columns represent blank strips, and dark columns represent NaCl taste strips for each TAS2R38 genotype. (D) Hedonic responses to 0.01, 0.1, and 1.0M NaCl solutions. Clear columns represent water controls, light gray columns represent 0.01M NaCl, dark gray columns represent 0.10M NaCl, and black columns represent 1.0M NaCl.

