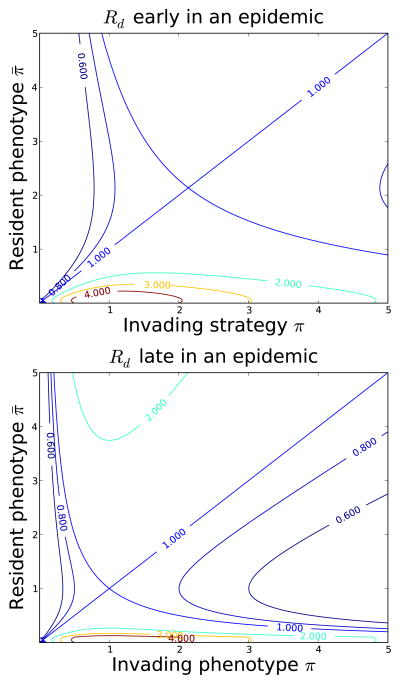
Figure 2.
Contour plots of
 (π, π̄) early (top) and late (bottom) in the course of an epidemic described by equation (40). Nash equilibria correspond to the phenotypes where the 1-contours intersect. At the start of an epidemic, the number of susceptibles is independent of the strategies and the number of infections is growing exponentially. However, near the end of an epidemic, the number of susceptible individuals at dynamic equilibrium depends on the population’s resident phenotype π̄, although there is no net change in the number of susceptible individuals per unit time. Because of these differences, the Nash equilibrium π* for the rate of leaving the exposed class is more than twice as large early compared to late in the epidemic. Parameter values μE = μI = 0, γ = 10, m = 1/60, η/m = 100. The early plot is for the naive population, S = 100. For the late plot, S is given by equation (46).

