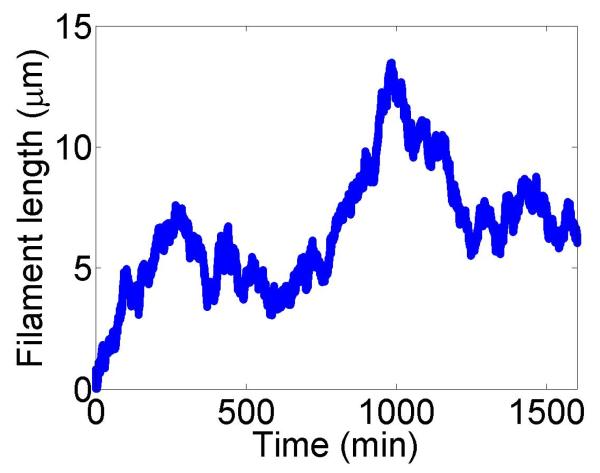
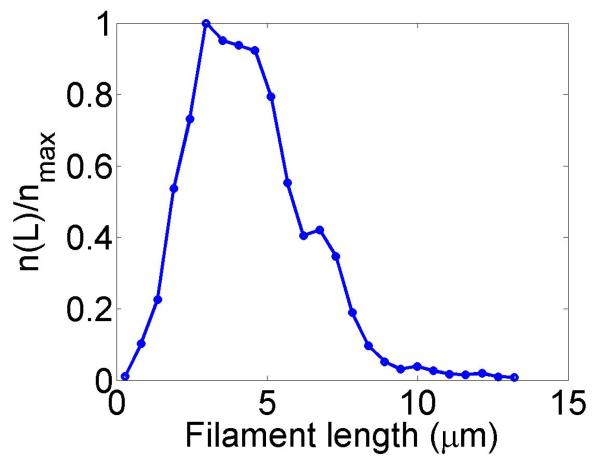
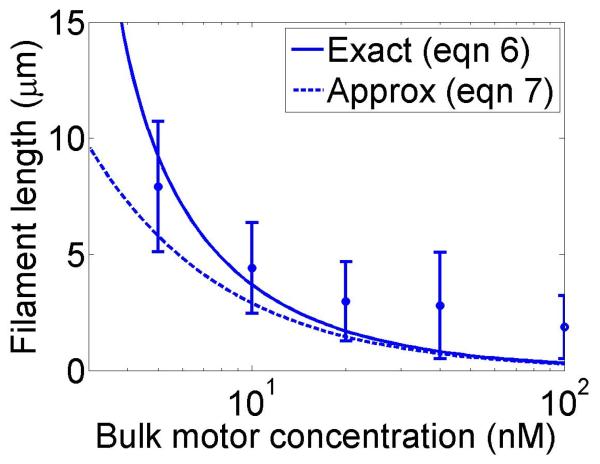
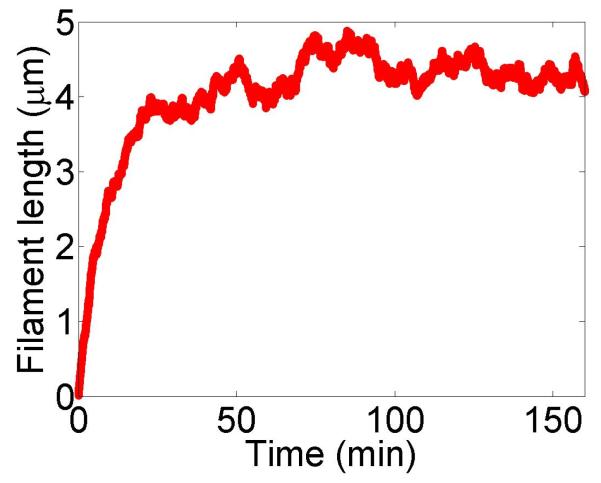
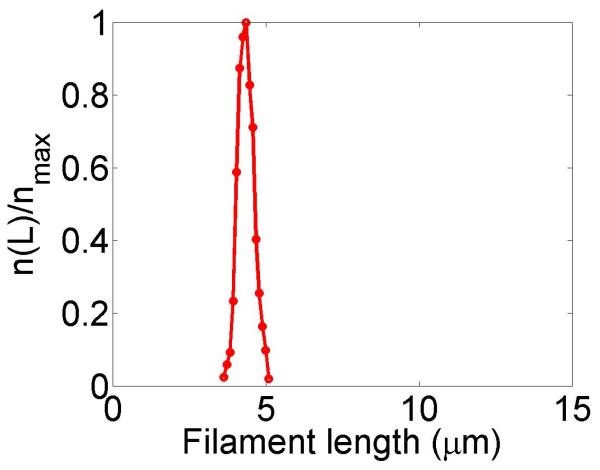
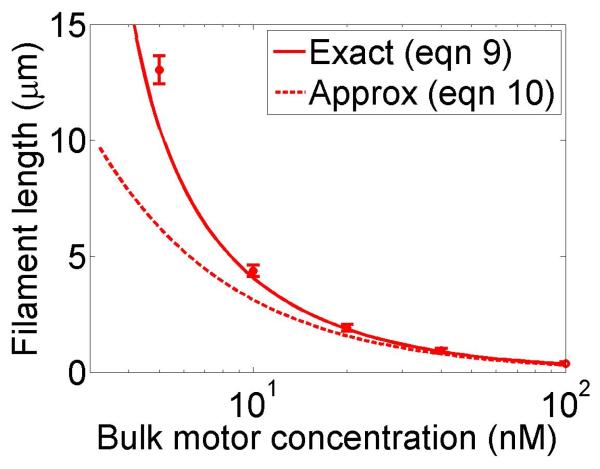
Figure 2.
Filament dynamics and steady-state filament length for length regulation by depolymerization. Blue (top), density-controlled depolymerization; red (bottom), flux-controlled depolymerization. Left, example trace of filament length versus time in the stochastic simulation for c = 10 nM. Middle, normalized filament length distribution in the stochastic simulation for c = 10 nM, averaged from 10 stochastic simulations after removal of the initial transient. Right, steady-state filament length predictions of mean-field theory and the stochastic simulation (error bars are standard deviations of steady-state length distributions). The steady-state length varies rapidly with the bulk motor concentration. The two models give similar predictions, and the approximate expressions (eqns 7 and 10) for the steady-state length are within a factor of two of the exact expressions (eqns 6 and 9) except for very low bulk motor concentrations. The mean-field theory uses the parameters v = 3 μm min−1, kon = 2 nM−1μm−1 min−1, koff = 0.25 min−1, min−1, w = 1.025 μm min−1, a = 8 nm, δ = 8 nm, and ρmax = 125 μm−1; for the density-controlled model u = 1.0 μm min−1 while for the flux-controlled model u = 0.5 μm min−1. The stochastic simulation uses the same parameters except w = 1.5 μm min−1 and min−1 off for the density-controlled model.

