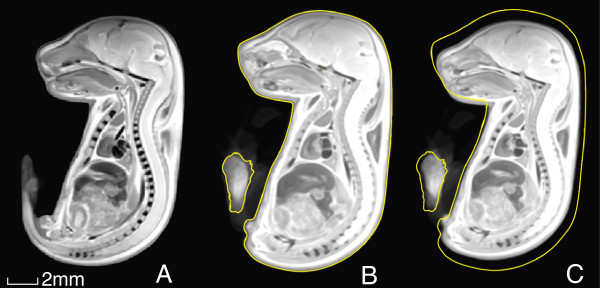
Figure 4.

Embryonic size difference at E17.5. (A) A consensus average of all E17.5 embryos constructed using the SD and KD MRI embryo images (N = 20), followed by separate averages of (B) all SD (N = 10) and (C) all KD (N = 10) E17.5 embryos. The outline of the SD embryo is traced in yellow in (c) to illustrate the overall size difference compared with the KD embryo.
