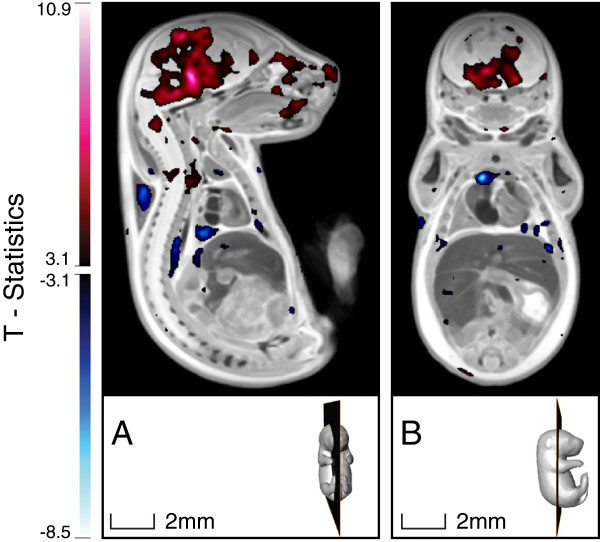
Figure 8.
T-statistics map overlaid on top of the registered E17.5 embryo image, highlighting voxels in the KD embryo that had statistically different deformations compared with those of the SD embryo (FDR ≤ 10%). Red regions are statistically larger in the KD embryo, whereas blue regions are statistically smaller in the KD compared with the SD embryo.

