Figure 5.

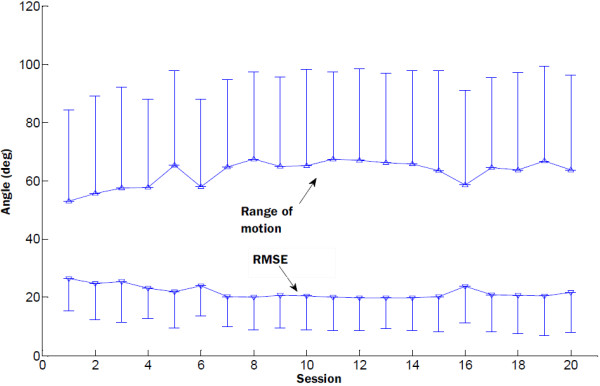
Group mean RMSE and the range of motion; group mean RMSE and the range of motion of all subjects in the 20 training sessions. Vertical bars represent the standard deviation.

Group mean RMSE and the range of motion; group mean RMSE and the range of motion of all subjects in the 20 training sessions. Vertical bars represent the standard deviation.