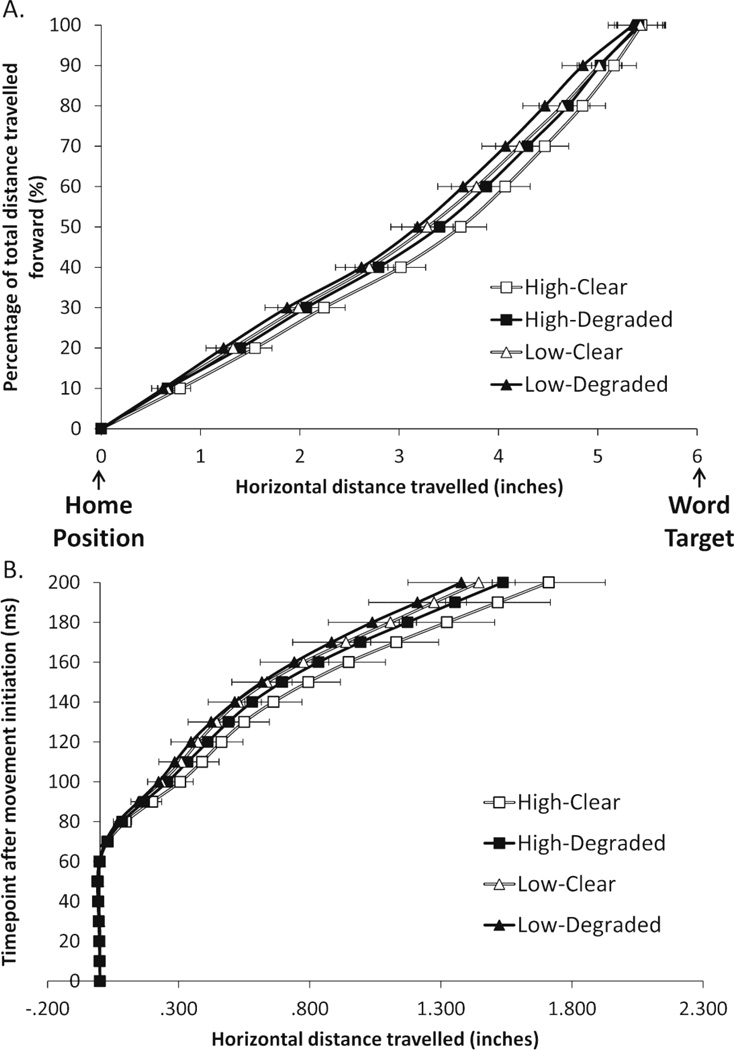
Figure 2.
Panel A shows the horizontal deviations toward the word target for each 20% portion of the total distance travelled forward (represented on the y-axis). Panel B shows the horizontal deviations toward the word target for each 10 ms time point after movement initiation. In both panels data are plotted for HF and LF word responses under clear and degraded conditions. Note that all data have been plotted as if the word response target was on the right side of the screen, even though this was counterbalanced across participants. Error bars are ± 1 standard error around the mean.

