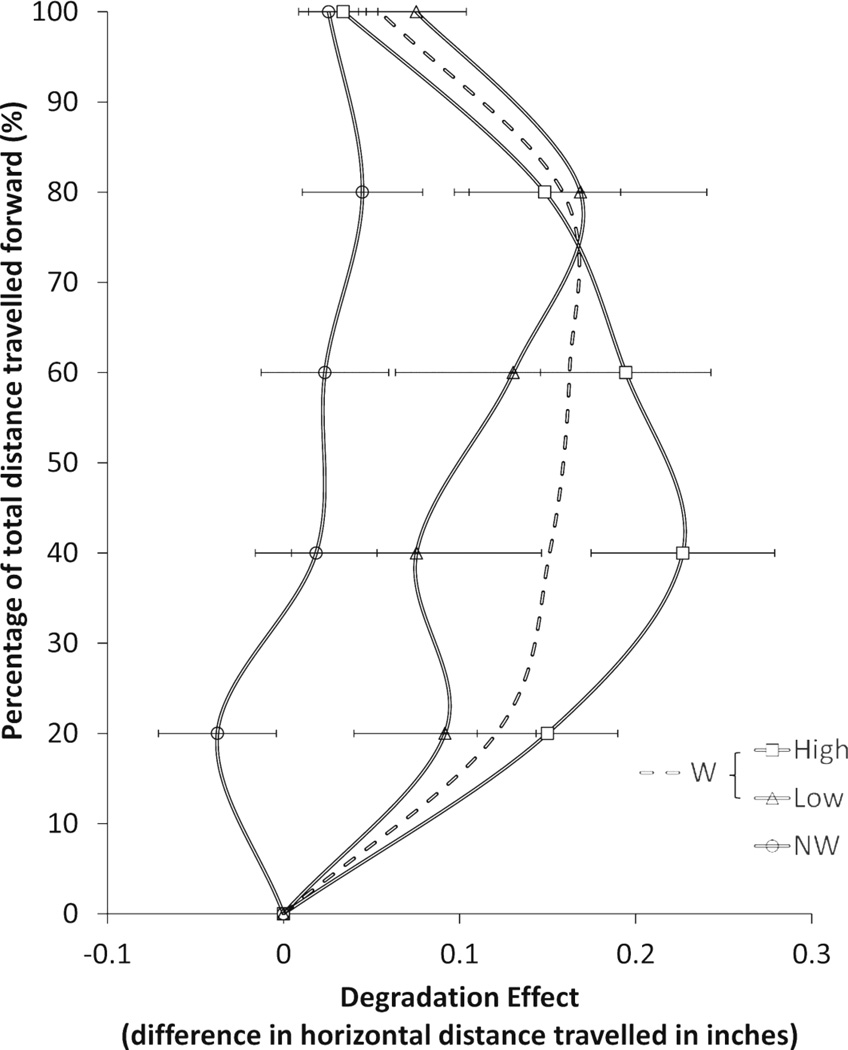
Figure 3.
The degradation effect (the difference in the horizontal distance travelled for clear versus degraded stimuli) across response movements for HF and LF words and for non-words (NW). The dashed line shows the degradation effect for word (W) stimuli combined. Larger x-axis values represent larger differences between clear and degraded conditions for the indicated stimulus type. The degradation effect was much larger for HF as compared to LF words for the beginning portion of people's movements, with the degradation effect increasing towards the end of movements for LF words. Additionally, stimulus degradation had a larger impact on word as compared to non-word trajectories throughout the course of response movements. Specifically, responses for degraded words moved less directly towards the word target than responses for clear words. However, degradation of non-words had little impact on how directly responses moved towards the non-word target. Error bars are ± 1 standard error around the mean.

